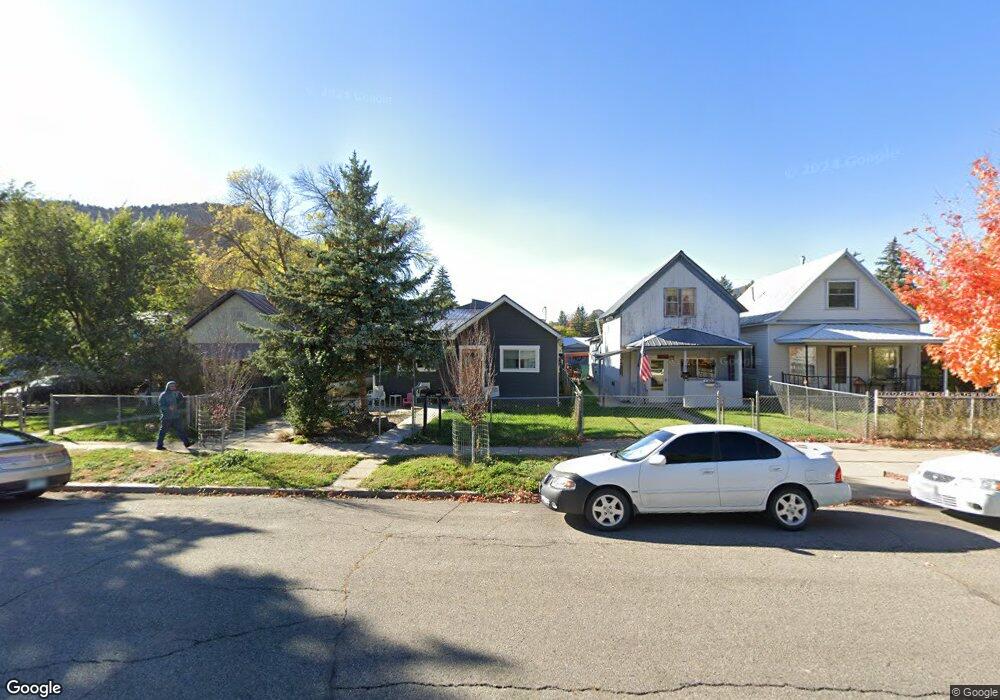
343 E 6th Ave Durango, CO 81301
So Co NeighborhoodEstimated Value: $797,000 - $1,059,000
4
Beds
4
Baths
2,140
Sq Ft
$420/Sq Ft
Est. Value
About This Home
This home is located at 343 E 6th Ave, Durango, CO 81301 and is currently estimated at $899,186, approximately $420 per square foot. 343 E 6th Ave is a home located in La Plata County with nearby schools including Park Elementary School, Escalante Middle School, and Durango High School.
Ownership History
Date
Name
Owned For
Owner Type
Purchase Details
Closed on
Jan 6, 2021
Sold by
Fearney Kelly and Hillyer Tae
Bought by
Fearney Kelly A and Hillyer Tae Y
Current Estimated Value
Home Financials for this Owner
Home Financials are based on the most recent Mortgage that was taken out on this home.
Original Mortgage
$102,600
Outstanding Balance
$75,002
Interest Rate
2.7%
Mortgage Type
New Conventional
Estimated Equity
$824,184
Purchase Details
Closed on
Feb 21, 2020
Sold by
Shrum James L
Bought by
Skarbek Valeria
Home Financials for this Owner
Home Financials are based on the most recent Mortgage that was taken out on this home.
Original Mortgage
$308,750
Outstanding Balance
$273,377
Interest Rate
3.6%
Mortgage Type
New Conventional
Estimated Equity
$625,809
Purchase Details
Closed on
Nov 9, 2001
Bought by
Shrum James L
Create a Home Valuation Report for This Property
The Home Valuation Report is an in-depth analysis detailing your home's value as well as a comparison with similar homes in the area
Home Values in the Area
Average Home Value in this Area
Purchase History
| Date | Buyer | Sale Price | Title Company |
|---|---|---|---|
| Fearney Kelly A | -- | Land Title Guarantee | |
| Skarbek Valeria | $325,000 | Durango Title | |
| Shrum James L | $205,000 | -- |
Source: Public Records
Mortgage History
| Date | Status | Borrower | Loan Amount |
|---|---|---|---|
| Open | Fearney Kelly A | $102,600 | |
| Open | Skarbek Valeria | $308,750 |
Source: Public Records
Tax History
| Year | Tax Paid | Tax Assessment Tax Assessment Total Assessment is a certain percentage of the fair market value that is determined by local assessors to be the total taxable value of land and additions on the property. | Land | Improvement |
|---|---|---|---|---|
| 2025 | $1,907 | $55,180 | $18,810 | $36,370 |
| 2024 | $1,401 | $40,370 | $13,940 | $26,430 |
| 2023 | $1,401 | $37,910 | $14,960 | $22,950 |
| 2022 | $1,258 | $39,980 | $15,780 | $24,200 |
| 2021 | $1,148 | $28,930 | $13,590 | $15,340 |
| 2020 | $1,198 | $31,160 | $13,440 | $17,720 |
| 2019 | $0 | $31,160 | $13,440 | $17,720 |
| 2018 | $1,066 | $29,360 | $12,740 | $16,620 |
| 2017 | $1,043 | $29,360 | $12,740 | $16,620 |
| 2016 | $945 | $28,980 | $12,180 | $16,800 |
| 2015 | $885 | $28,980 | $12,180 | $16,800 |
| 2014 | -- | $26,100 | $11,700 | $14,400 |
| 2013 | -- | $26,100 | $11,700 | $14,400 |
Source: Public Records
Map
Nearby Homes
- 378 E 6th Ave
- 732 E 4th St
- 703 E 4th St
- 555 E 7th Ave
- 561 E 6th Ave
- 458 E 4th Ave
- 549 E 5th Ave
- 190 E 7th Ave Unit A-2
- 558 E 4th Ave
- 562 E 1st St
- 522 E 3rd Ave
- 1 E 6th Ave Unit 5
- 355 E 3rd Ave Unit 112
- 610 E 3rd Ave
- 270 E College Dr Unit 202
- 543 E 2nd Ave Unit 1D
- 543 E 2nd Ave Unit 3E
- 0 Tbd Unit 11662135
- 0 Tbd Unit 26426680
- 834 E 4th Ave
Your Personal Tour Guide
Ask me questions while you tour the home.