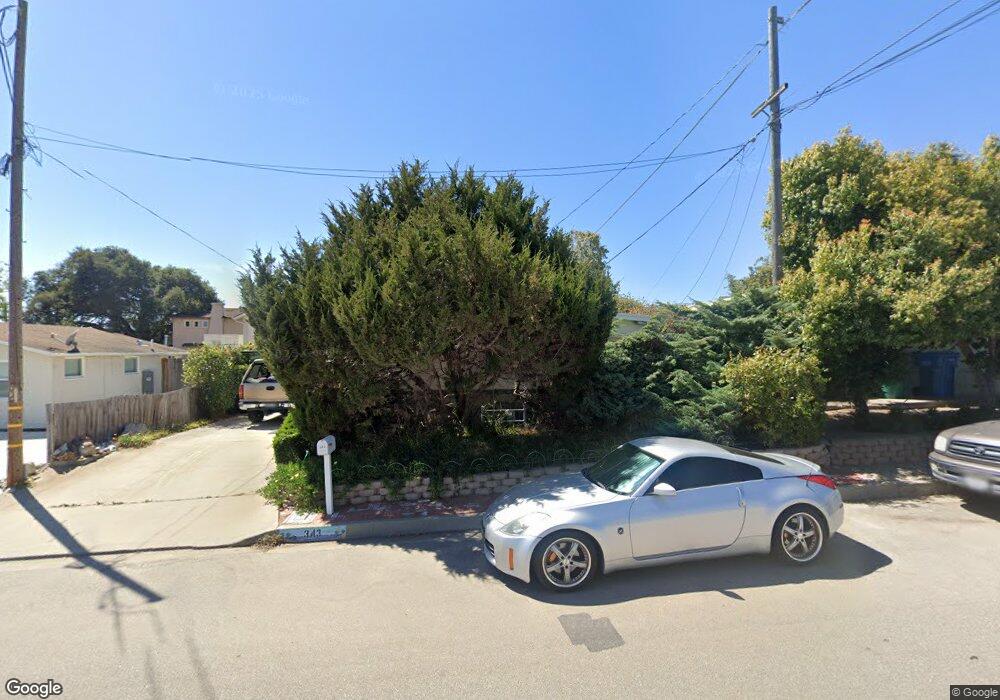
343 N 16th St Grover Beach, CA 93433
Estimated Value: $573,384 - $732,000
2
Beds
1
Bath
800
Sq Ft
$816/Sq Ft
Est. Value
About This Home
This home is located at 343 N 16th St, Grover Beach, CA 93433 and is currently estimated at $652,692, approximately $815 per square foot. 343 N 16th St is a home located in San Luis Obispo County with nearby schools including Grover Heights Elementary School, Judkins Middle School, and Arroyo Grande High School.
Ownership History
Date
Name
Owned For
Owner Type
Purchase Details
Closed on
Sep 30, 1997
Sold by
Harper Johnnie C and Harper Maryann
Bought by
Smith Thomas Joseph and Smith Bonnie Jo
Current Estimated Value
Home Financials for this Owner
Home Financials are based on the most recent Mortgage that was taken out on this home.
Original Mortgage
$104,601
Outstanding Balance
$16,864
Interest Rate
7.49%
Mortgage Type
FHA
Estimated Equity
$635,828
Purchase Details
Closed on
Aug 17, 1995
Sold by
Harper Carl E and Harper Sarah V
Bought by
Harper Johnnie C and Harper Maryann
Home Financials for this Owner
Home Financials are based on the most recent Mortgage that was taken out on this home.
Original Mortgage
$28,800
Interest Rate
7.88%
Create a Home Valuation Report for This Property
The Home Valuation Report is an in-depth analysis detailing your home's value as well as a comparison with similar homes in the area
Home Values in the Area
Average Home Value in this Area
Purchase History
| Date | Buyer | Sale Price | Title Company |
|---|---|---|---|
| Smith Thomas Joseph | $105,000 | Chicago Title Co | |
| Harper Johnnie C | $29,500 | Chicago Title Co |
Source: Public Records
Mortgage History
| Date | Status | Borrower | Loan Amount |
|---|---|---|---|
| Open | Smith Thomas Joseph | $104,601 | |
| Previous Owner | Harper Johnnie C | $28,800 |
Source: Public Records
Tax History Compared to Growth
Tax History
| Year | Tax Paid | Tax Assessment Tax Assessment Total Assessment is a certain percentage of the fair market value that is determined by local assessors to be the total taxable value of land and additions on the property. | Land | Improvement |
|---|---|---|---|---|
| 2025 | $1,802 | $167,621 | $111,755 | $55,866 |
| 2024 | $1,786 | $164,335 | $109,564 | $54,771 |
| 2023 | $1,786 | $161,114 | $107,416 | $53,698 |
| 2022 | $1,757 | $157,956 | $105,310 | $52,646 |
| 2021 | $1,734 | $154,860 | $103,246 | $51,614 |
| 2020 | $1,714 | $153,273 | $102,188 | $51,085 |
| 2019 | $1,698 | $150,269 | $100,185 | $50,084 |
| 2018 | $1,676 | $147,323 | $98,221 | $49,102 |
| 2017 | $1,600 | $144,436 | $96,296 | $48,140 |
| 2016 | $1,489 | $141,605 | $94,408 | $47,197 |
| 2015 | $1,454 | $139,479 | $92,990 | $46,489 |
| 2014 | $1,369 | $136,748 | $91,169 | $45,579 |
Source: Public Records
Map
Nearby Homes
- 1747 Brighton Ave
- 1773 Newport Ave
- 172 N 13th St
- 453 N 13th St
- 1950 Newport Ave
- 0 N 11th St
- 1566 Hillcrest Dr
- 676 N 12th St Unit 6
- 850 N 12th St
- 242 N 10th St
- 147 S 11th St
- 280 Chelsea Ct
- 910 N 12th St
- 0 N Oak Park Blvd
- 166 S 10th St
- 182 Fair View Dr
- 241 S 10th St
- 319 California 1
- 866 Brighton Ave
- 1032 Margarita
- 359 N 16th St
- 335 N 16th St
- 1551 Brighton Ave
- 1549 Brighton Ave
- 1595 Brighton Ave
- 1548 Newport Ave
- 1533 Brighton Ave
- 356 N 16th St
- 1550 Newport Ave
- 367 N 16th St
- 1531 Brighton Ave Unit 3
- 1531 Brighton Ave Unit 2
- 1531 Brighton Ave Unit 1
- 1531 Brighton Ave
- 1531 Brighton # 3 Ave
- 1531 Brighton # 2 Ave
- 1531 Brighton # 1 Ave
- 336 N 16th St
- 1547 Brighton Ave
- 1529 Brighton Ave