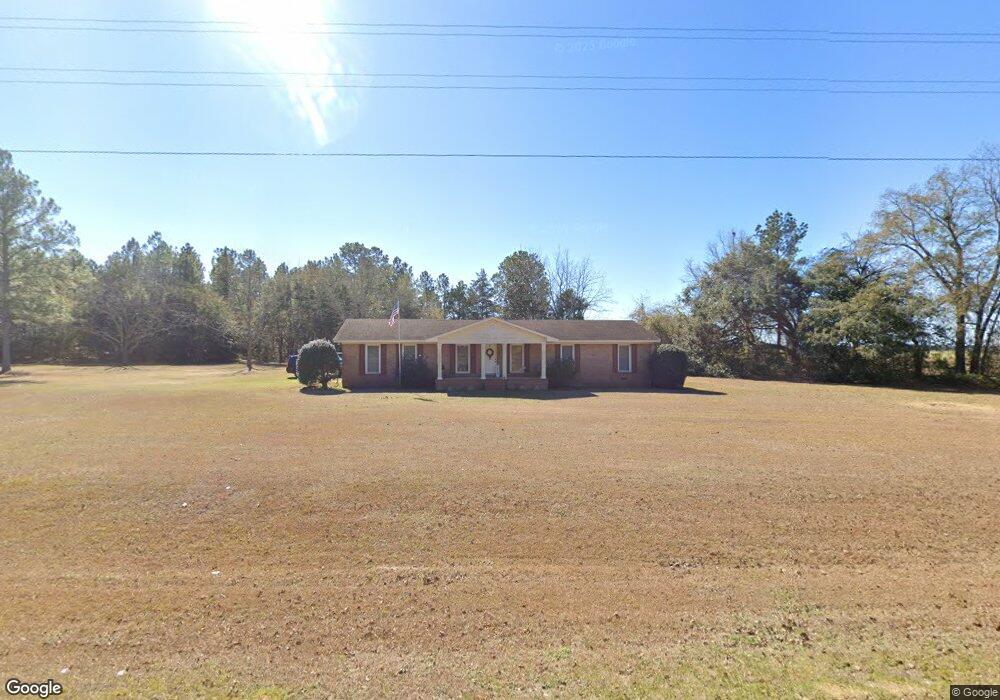
343 Whigham Rd Whigham, GA 39897
Estimated Value: $198,000 - $301,000
3
Beds
2
Baths
2,030
Sq Ft
$124/Sq Ft
Est. Value
About This Home
This home is located at 343 Whigham Rd, Whigham, GA 39897 and is currently estimated at $252,077, approximately $124 per square foot. 343 Whigham Rd is a home located in Grady County.
Ownership History
Date
Name
Owned For
Owner Type
Purchase Details
Closed on
May 7, 2008
Sold by
Harrison Brian C
Bought by
Harrison Valarie K and Harrison Brian C
Current Estimated Value
Purchase Details
Closed on
May 30, 2001
Sold by
Harrison Hurschel
Bought by
Harrison Brian C
Purchase Details
Closed on
Jul 24, 1979
Sold by
Harrison Hurschel
Bought by
Harrison Hurschel
Create a Home Valuation Report for This Property
The Home Valuation Report is an in-depth analysis detailing your home's value as well as a comparison with similar homes in the area
Purchase History
| Date | Buyer | Sale Price | Title Company |
|---|---|---|---|
| Harrison Valarie K | -- | -- | |
| Harrison Brian C | $100,000 | -- | |
| Harrison Hurschel | -- | -- |
Source: Public Records
Tax History
| Year | Tax Paid | Tax Assessment Tax Assessment Total Assessment is a certain percentage of the fair market value that is determined by local assessors to be the total taxable value of land and additions on the property. | Land | Improvement |
|---|---|---|---|---|
| 2025 | $1,819 | $95,336 | $6,778 | $88,558 |
| 2024 | $1,819 | $75,716 | $6,778 | $68,938 |
| 2023 | $1,490 | $50,397 | $4,351 | $46,046 |
| 2022 | $1,490 | $50,397 | $4,351 | $46,046 |
| 2021 | $1,495 | $50,397 | $4,351 | $46,046 |
| 2020 | $1,500 | $50,397 | $4,351 | $46,046 |
| 2019 | $1,500 | $50,397 | $4,351 | $46,046 |
| 2018 | $1,408 | $50,023 | $4,351 | $45,672 |
| 2017 | $1,330 | $50,023 | $4,351 | $45,672 |
| 2016 | $1,139 | $42,910 | $4,351 | $38,558 |
| 2015 | $1,126 | $42,910 | $4,351 | $38,558 |
| 2014 | $1,127 | $42,910 | $4,351 | $38,558 |
| 2013 | -- | $41,103 | $6,102 | $35,001 |
Source: Public Records
Map
Nearby Homes
- 53 +/- A Bond Rd
- 189 Sabino Dr
- 565 Bond Rd
- 1741 Georgia 112
- 0 County Line Rd Unit 167502
- 0 Greene Rd
- 000 Noles Rd
- 1521 Stage Coach Rd
- 0 N 111 Hwy
- 0 Wade Rd
- Rich Rd
- 1016 Richter Rd
- 272 Homers Rd
- 0 Cal Thomas Rd
- Tbd Cumbie Rd
- 835 Mill Pond Rd
- 0 Cumbie Rd
- 425 Woodridge Ln
- 415 Woodridge Ln
- 397 Woodridge Ln
Your Personal Tour Guide
Ask me questions while you tour the home.