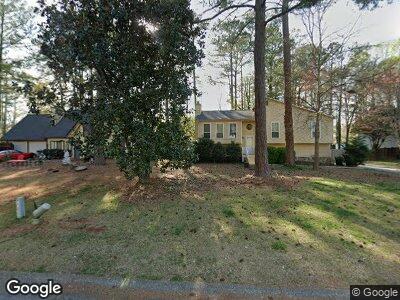
3430 Mallard Glen Dr SW Smyrna, GA 30082
Estimated Value: $348,000 - $396,000
5
Beds
3
Baths
1,966
Sq Ft
$188/Sq Ft
Est. Value
About This Home
This home is located at 3430 Mallard Glen Dr SW, Smyrna, GA 30082 and is currently estimated at $369,093, approximately $187 per square foot. 3430 Mallard Glen Dr SW is a home located in Cobb County with nearby schools including Russell Elementary School, Floyd Middle School, and Osborne High School.
Ownership History
Date
Name
Owned For
Owner Type
Purchase Details
Closed on
May 2, 2007
Sold by
Rincon Maria B
Bought by
Rincon Maria B and Estrada Gabriel
Current Estimated Value
Home Financials for this Owner
Home Financials are based on the most recent Mortgage that was taken out on this home.
Original Mortgage
$164,000
Outstanding Balance
$104,643
Interest Rate
6.11%
Mortgage Type
New Conventional
Purchase Details
Closed on
Oct 25, 2001
Sold by
Ward Mark H and Ward Monica L
Bought by
Banuelos Antonio and Banuelos Priscila
Home Financials for this Owner
Home Financials are based on the most recent Mortgage that was taken out on this home.
Original Mortgage
$135,700
Interest Rate
6.67%
Mortgage Type
New Conventional
Purchase Details
Closed on
Oct 31, 2000
Sold by
Ward Mark H
Bought by
Ward Mark H and Ward Monica L
Home Financials for this Owner
Home Financials are based on the most recent Mortgage that was taken out on this home.
Original Mortgage
$131,813
Interest Rate
7.93%
Mortgage Type
FHA
Create a Home Valuation Report for This Property
The Home Valuation Report is an in-depth analysis detailing your home's value as well as a comparison with similar homes in the area
Home Values in the Area
Average Home Value in this Area
Purchase History
| Date | Buyer | Sale Price | Title Company |
|---|---|---|---|
| Rincon Maria B | -- | -- | |
| Rincon Maria B | $164,000 | -- | |
| Banuelos Antonio | $139,900 | -- | |
| Ward Mark H | -- | -- | |
| Ward Mark H | $132,900 | -- |
Source: Public Records
Mortgage History
| Date | Status | Borrower | Loan Amount |
|---|---|---|---|
| Open | Rincon Maria B | $164,000 | |
| Previous Owner | Banuelos Antonio | $142,200 | |
| Previous Owner | Banuelos Antonio | $135,700 | |
| Previous Owner | Ward Mark H | $131,813 |
Source: Public Records
Tax History Compared to Growth
Tax History
| Year | Tax Paid | Tax Assessment Tax Assessment Total Assessment is a certain percentage of the fair market value that is determined by local assessors to be the total taxable value of land and additions on the property. | Land | Improvement |
|---|---|---|---|---|
| 2024 | $5,320 | $176,464 | $30,000 | $146,464 |
| 2023 | $2,676 | $88,760 | $30,000 | $58,760 |
| 2022 | $2,694 | $88,760 | $30,000 | $58,760 |
| 2021 | $2,694 | $88,760 | $30,000 | $58,760 |
| 2020 | $2,464 | $81,172 | $16,000 | $65,172 |
| 2019 | $1,874 | $61,748 | $16,000 | $45,748 |
| 2018 | $1,874 | $61,748 | $16,000 | $45,748 |
| 2017 | $1,775 | $61,748 | $16,000 | $45,748 |
| 2016 | $1,775 | $61,748 | $16,000 | $45,748 |
| 2015 | $1,554 | $52,764 | $17,280 | $35,484 |
| 2014 | $1,568 | $52,764 | $0 | $0 |
Source: Public Records
Map
Nearby Homes
- 3624 Nessa Ct SE
- 3664 Nessa Ct SE
- 3219 Blackshear Dr
- 82 Vanessa Dr SE
- 3727 Cline Dr SE
- 43 Landmark Ln SW
- 315 Renae Ln SW
- 244 Hurt Dr SE
- 3216 Woodview Dr SE
- 0 Geraldine Dr SE Unit 10459819
- 0 Geraldine Dr SE Unit 7524743
- 14 Geraldine Dr SE
- 22 Geraldine Dr SE
- 18 Geraldine Dr SE
- 3819 Dora Dr SE
- 3065 Moser Way
- 4005 Saddlebrook Creek Dr
- 218 Woodview Ln SE
- 3430 Mallard Glen Dr SW
- 3420 Mallard Glen Dr SW
- 3410 Mallard Cove SW
- 3431 Mallard Glen Dr SW
- 3421 Mallard Glen Dr SW
- 0 Mallard Glen
- 158 Hurt Rd SW
- 3415 Mallard Glen Dr SW
- 3400 Mallard Cove SW
- 3475 Lakeshore Dr SW
- 3401 Mallard Cove SW
- 170 Hurt Rd SW
- 3427 Maxwell Dr SW Unit C
- 3468 Lakeshore Dr SW
- 3351 Mallard Cove SW
- 0 Mallard Cove SW Unit 7268491
- 0 Mallard Cove SW Unit 8856936
- 0 Mallard Cove SW Unit 8806118
- 0 Mallard Cove SW Unit 8782018
- 0 Mallard Cove SW