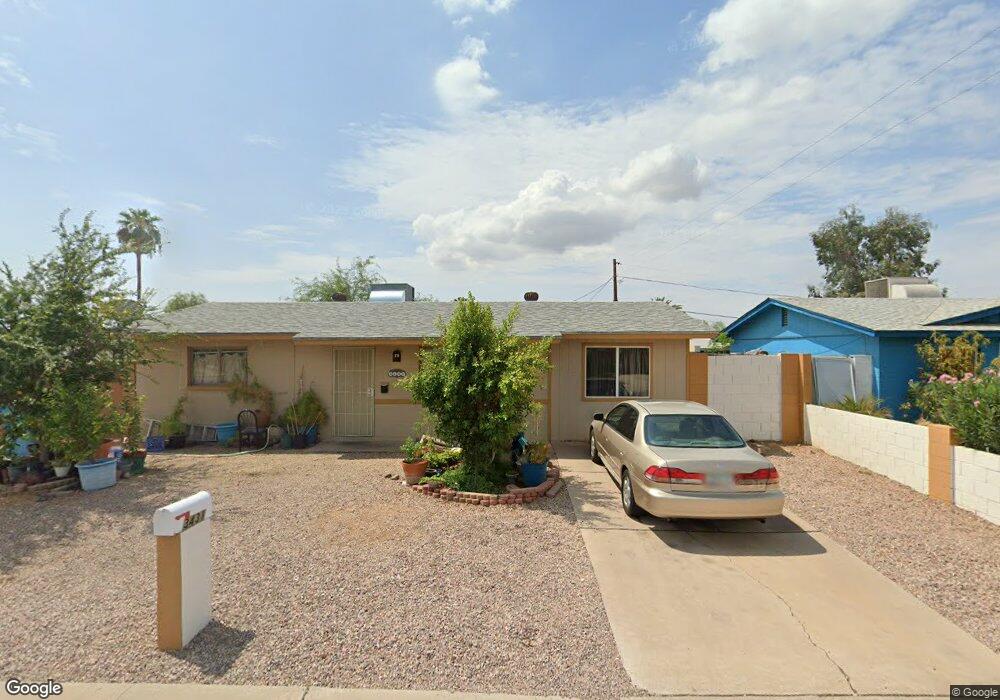
3431 E Hillery Dr Unit <WOW!> Phoenix, AZ 85032
Paradise Valley Village NeighborhoodEstimated Value: $278,224 - $385,000
2
Beds
2
Baths
1,100
Sq Ft
$314/Sq Ft
Est. Value
About This Home
This home is located at 3431 E Hillery Dr Unit
Ownership History
Date
Name
Owned For
Owner Type
Purchase Details
Closed on
Sep 21, 2001
Sold by
Garrido Agustin
Bought by
Garrido Agustin and Garrido Rosa E
Current Estimated Value
Purchase Details
Closed on
Sep 7, 2001
Sold by
Garrido Rosa E and Degarrido Rosa E Rojas
Bought by
Garrido Agustin
Purchase Details
Closed on
Jul 1, 1998
Sold by
Paulson Tamira
Bought by
Paulson Tamira and Austin Darrin W
Home Financials for this Owner
Home Financials are based on the most recent Mortgage that was taken out on this home.
Original Mortgage
$62,910
Interest Rate
9.6%
Mortgage Type
New Conventional
Purchase Details
Closed on
Jun 30, 1998
Sold by
Smith Kevin G
Bought by
Paulson Tamira
Home Financials for this Owner
Home Financials are based on the most recent Mortgage that was taken out on this home.
Original Mortgage
$62,910
Interest Rate
9.6%
Mortgage Type
New Conventional
Create a Home Valuation Report for This Property
The Home Valuation Report is an in-depth analysis detailing your home's value as well as a comparison with similar homes in the area
Home Values in the Area
Average Home Value in this Area
Purchase History
| Date | Buyer | Sale Price | Title Company |
|---|---|---|---|
| Garrido Agustin | -- | Transnation Title Insurance | |
| Garrido Agustin | -- | Transnation Title Insurance | |
| Garrido Agustin | $112,500 | Transnation Title Insurance | |
| Paulson Tamira | -- | Fidelity Title | |
| Paulson Tamira | $69,900 | Fidelity Title |
Source: Public Records
Mortgage History
| Date | Status | Borrower | Loan Amount |
|---|---|---|---|
| Previous Owner | Paulson Tamira | $62,910 |
Source: Public Records
Tax History Compared to Growth
Tax History
| Year | Tax Paid | Tax Assessment Tax Assessment Total Assessment is a certain percentage of the fair market value that is determined by local assessors to be the total taxable value of land and additions on the property. | Land | Improvement |
|---|---|---|---|---|
| 2025 | $996 | $10,006 | -- | -- |
| 2024 | $975 | $9,530 | -- | -- |
| 2023 | $975 | $21,950 | $4,390 | $17,560 |
| 2022 | $965 | $16,720 | $3,340 | $13,380 |
| 2021 | $968 | $14,550 | $2,910 | $11,640 |
| 2020 | $938 | $13,080 | $2,610 | $10,470 |
| 2019 | $940 | $11,200 | $2,240 | $8,960 |
| 2018 | $909 | $9,680 | $1,930 | $7,750 |
| 2017 | $871 | $8,750 | $1,750 | $7,000 |
| 2016 | $856 | $8,600 | $1,720 | $6,880 |
| 2015 | $605 | $8,220 | $1,640 | $6,580 |
Source: Public Records
Map
Nearby Homes
- 14820 N 35th St
- 3419 E Hillery Dr
- 14832 N 36th St
- 14622 N 37th St
- 14808 N 37th Way
- 14616 N 33rd St
- 14842 N 38th St
- 15243 N 37th Place
- 3534 E Friess Dr
- 3615 E Hearn Rd
- 3774 E Evans Dr
- 3545 E Friess Dr
- 3908 E Marilyn Rd
- 3630 E Friess Dr
- 3845 E Greenway Rd Unit 230
- 3620 E Ludlow Dr
- 15020 N 40th St Unit 41
- 15621 N 37th St Unit 46
- 15616 N 33rd Place
- 3542 E Sharon Dr
- 3431 E Hillery Dr
- 3425 E Hillery Dr
- 3434 E Marilyn Rd
- 3428 E Marilyn Rd
- 14825 N 34th Place
- 14831 N 34th Place
- 3432 E Hillery Dr
- 14819 N 34th Place
- 3426 E Hillery Dr
- 3422 E Marilyn Rd
- 14835 N 34th Place
- 3420 E Hillery Dr
- 14813 N 34th Place
- 14808 N 34th Place
- 14841 N 34th Place
- 14826 N 35th St
- 14832 N 35th St
- 3431 E Nisbet Rd
- 14807 N 34th St
- 3425 E Nisbet Rd