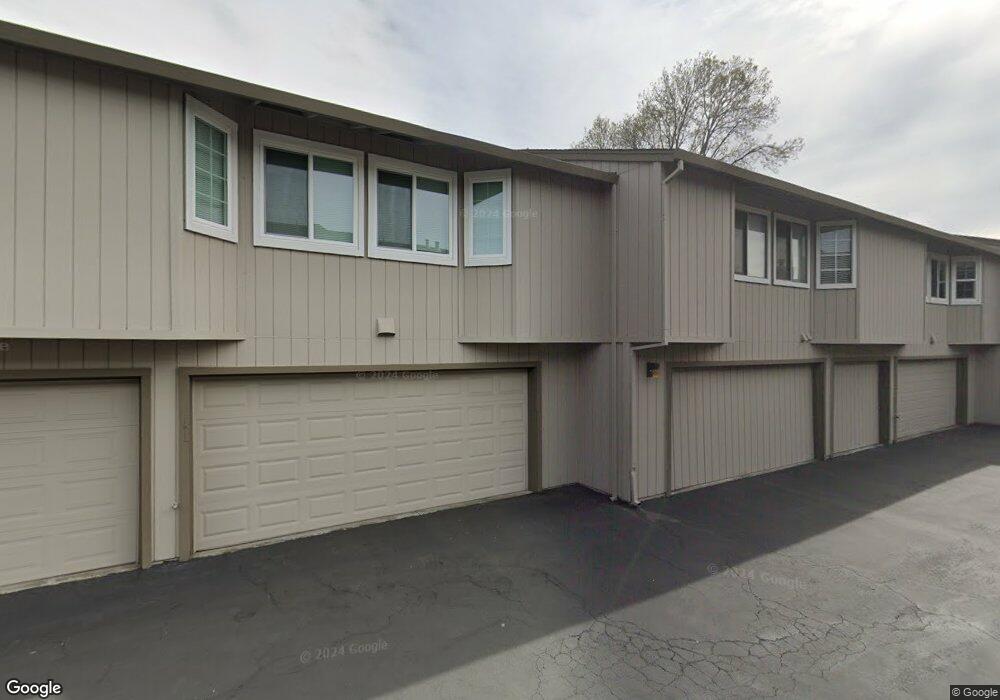
3434 Wine Cork Way San Jose, CA 95124
Cambrian NeighborhoodEstimated Value: $688,000 - $844,000
2
Beds
2
Baths
960
Sq Ft
$762/Sq Ft
Est. Value
About This Home
This home is located at 3434 Wine Cork Way, San Jose, CA 95124 and is currently estimated at $731,108, approximately $761 per square foot. 3434 Wine Cork Way is a home located in Santa Clara County with nearby schools including Leigh High School, Branham High School, and Farnham Elementary School.
Ownership History
Date
Name
Owned For
Owner Type
Purchase Details
Closed on
Jun 23, 2011
Sold by
Romero Marissa
Bought by
Chikhani Reiad S and Chikhani Nancy L
Current Estimated Value
Purchase Details
Closed on
Dec 14, 2006
Sold by
Chikhani Marla
Bought by
Romero Marissa
Home Financials for this Owner
Home Financials are based on the most recent Mortgage that was taken out on this home.
Original Mortgage
$93,500
Interest Rate
6.16%
Mortgage Type
Stand Alone Second
Purchase Details
Closed on
Dec 15, 1999
Sold by
Wright Willard M
Bought by
Chikhani Marla A
Home Financials for this Owner
Home Financials are based on the most recent Mortgage that was taken out on this home.
Original Mortgage
$176,000
Interest Rate
7.82%
Create a Home Valuation Report for This Property
The Home Valuation Report is an in-depth analysis detailing your home's value as well as a comparison with similar homes in the area
Home Values in the Area
Average Home Value in this Area
Purchase History
| Date | Buyer | Sale Price | Title Company |
|---|---|---|---|
| Chikhani Reiad S | $270,000 | Old Republic Title Company | |
| Romero Marissa | $467,500 | Old Republic Title Company | |
| Chikhani Marla A | $220,000 | Old Republic Title Company |
Source: Public Records
Mortgage History
| Date | Status | Borrower | Loan Amount |
|---|---|---|---|
| Previous Owner | Romero Marissa | $93,500 | |
| Previous Owner | Romero Marissa | $374,000 | |
| Previous Owner | Chikhani Marla A | $176,000 |
Source: Public Records
Tax History Compared to Growth
Tax History
| Year | Tax Paid | Tax Assessment Tax Assessment Total Assessment is a certain percentage of the fair market value that is determined by local assessors to be the total taxable value of land and additions on the property. | Land | Improvement |
|---|---|---|---|---|
| 2025 | $4,855 | $339,124 | $169,562 | $169,562 |
| 2024 | $4,855 | $332,476 | $166,238 | $166,238 |
| 2023 | $4,811 | $325,958 | $162,979 | $162,979 |
| 2022 | $4,744 | $319,568 | $159,784 | $159,784 |
| 2021 | $4,648 | $313,302 | $156,651 | $156,651 |
| 2020 | $4,471 | $310,090 | $155,045 | $155,045 |
| 2019 | $4,428 | $304,010 | $152,005 | $152,005 |
| 2018 | $4,314 | $298,050 | $149,025 | $149,025 |
| 2017 | $4,182 | $292,206 | $146,103 | $146,103 |
| 2016 | $3,980 | $286,478 | $143,239 | $143,239 |
| 2015 | $3,926 | $282,176 | $141,088 | $141,088 |
| 2014 | $3,798 | $276,650 | $138,325 | $138,325 |
Source: Public Records
Map
Nearby Homes
- 3449 Wine Cask Way
- 3489 Wine Barrel Way
- 1500 Camden Ave
- 2785 S Bascom Ave Unit 26
- 3076 Union Ave
- 2258 Highland Park Ln
- 866 Stonehurst Way
- 2303 Saidel Dr Unit 4
- 4768 Hatfield Walk Unit 2
- 4787 Hatfield Walkway Unit 4
- 14361 Lenray Ln
- 14 Timber Cove Dr Unit 14
- 3274 Todd Way
- 99 Timber Cove Dr Unit 99
- 870 Camden Ave Unit 96
- 14802 Cole Dr
- 1504 Love Ct
- 615 Chapman Dr
- 2433 New Jersey Ave
- 14685 Oka Rd Unit 28
- 3432 Wine Cork Way
- 3436 Wine Cork Way
- 3438 Wine Cork Way Unit 56
- 3440 Wine Cork Way Unit 57
- 3433 Wine Cork Way
- 3428 Wine Cork Way Unit 51
- 3431 Wine Cork Way
- 3437 Wine Cork Way
- 3430 Wine Cork Way Unit 49
- 3435 Wine Cork Way
- 3427 Wine Cork Way
- 3439 Wine Cork Way
- 3444 Wine Cork Way Unit 59
- 3446 Wine Cork Way
- 3426 Wine Cork Way
- 3441 Wine Cork Way
- 3425 Wine Cork Way
- 3443 Wine Cork Way Unit 35
- 3429 Wine Cork Way
- 3463 Wine Cask Way