Estimated Value: $460,452 - $524,000
3
Beds
2
Baths
1,460
Sq Ft
$334/Sq Ft
Est. Value
About This Home
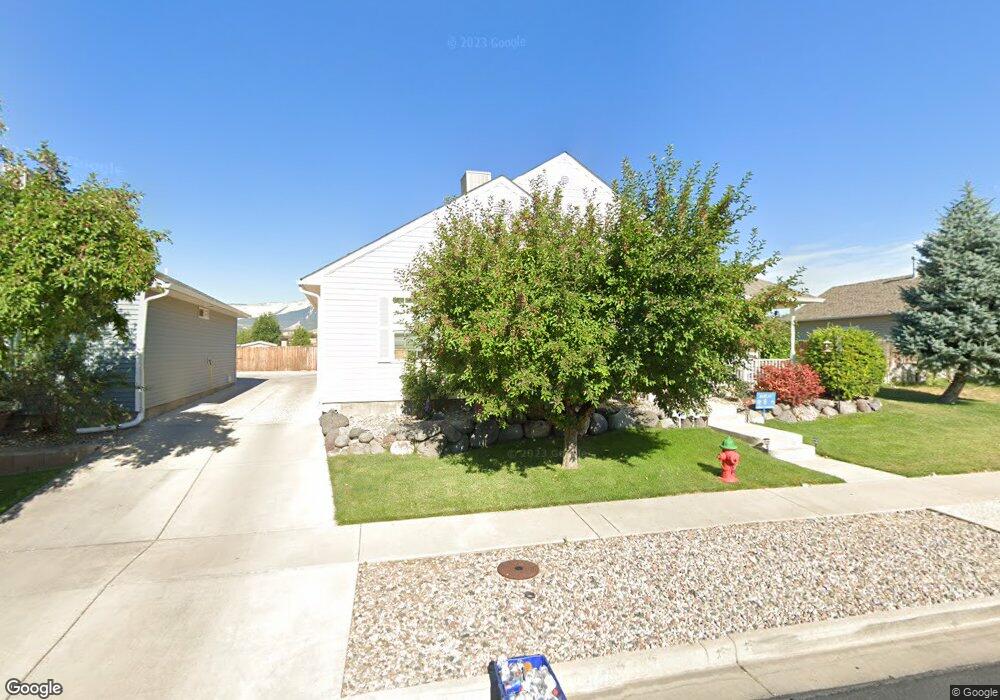
This home is located at 344 Columbine Dr, Rifle, CO 81650 and is currently estimated at $487,363, approximately $333 per square foot. 344 Columbine Dr is a home located in Garfield County with nearby schools including Wamsley Elementary School, Rifle Middle School, and Rifle High School.
Ownership History
Date
Name
Owned For
Owner Type
Purchase Details
Closed on
Sep 15, 2009
Sold by
Byers Travis and Byers Amanda
Bought by
Byers Travis
Current Estimated Value
Home Financials for this Owner
Home Financials are based on the most recent Mortgage that was taken out on this home.
Original Mortgage
$302,422
Outstanding Balance
$197,883
Interest Rate
5.2%
Mortgage Type
FHA
Estimated Equity
$289,480
Purchase Details
Closed on
Nov 20, 2007
Sold by
Byers Travis
Bought by
Byers Travis and Byers Amanda
Home Financials for this Owner
Home Financials are based on the most recent Mortgage that was taken out on this home.
Original Mortgage
$297,953
Interest Rate
6.42%
Mortgage Type
New Conventional
Purchase Details
Closed on
Aug 29, 2006
Sold by
Deerfield Park Llc
Bought by
Byers Travis
Home Financials for this Owner
Home Financials are based on the most recent Mortgage that was taken out on this home.
Original Mortgage
$199,920
Interest Rate
6.79%
Mortgage Type
Balloon
Create a Home Valuation Report for This Property
The Home Valuation Report is an in-depth analysis detailing your home's value as well as a comparison with similar homes in the area
Home Values in the Area
Average Home Value in this Area
Purchase History
| Date | Buyer | Sale Price | Title Company |
|---|---|---|---|
| Byers Travis | -- | Utc | |
| Byers Travis | -- | Commonwealth | |
| Byers Travis | $249,900 | Commonwealth |
Source: Public Records
Mortgage History
| Date | Status | Borrower | Loan Amount |
|---|---|---|---|
| Open | Byers Travis | $302,422 | |
| Closed | Byers Travis | $297,953 | |
| Closed | Byers Travis | $199,920 |
Source: Public Records
Tax History Compared to Growth
Tax History
| Year | Tax Paid | Tax Assessment Tax Assessment Total Assessment is a certain percentage of the fair market value that is determined by local assessors to be the total taxable value of land and additions on the property. | Land | Improvement |
|---|---|---|---|---|
| 2024 | $1,751 | $22,960 | $2,310 | $20,650 |
| 2023 | $1,751 | $22,960 | $2,310 | $20,650 |
| 2022 | $1,395 | $19,490 | $2,220 | $17,270 |
| 2021 | $1,603 | $20,050 | $2,290 | $17,760 |
| 2020 | $1,377 | $18,830 | $2,150 | $16,680 |
| 2019 | $1,303 | $18,830 | $2,150 | $16,680 |
| 2018 | $1,125 | $15,890 | $2,160 | $13,730 |
| 2017 | $1,017 | $15,890 | $2,160 | $13,730 |
| 2016 | $939 | $16,620 | $2,150 | $14,470 |
| 2015 | $867 | $16,620 | $2,150 | $14,470 |
| 2014 | -- | $11,670 | $1,750 | $9,920 |
Source: Public Records
Map
Nearby Homes
- 321 Columbine Dr
- 2659 Acacia Ave Unit 2C
- 148 W 26th St
- 2501 Meadow Cir Unit 1
- 211 W 28th Ct
- 2203 Ute Ave
- Phase 2 Rifle Creek
- Phase 1B Tbd Creekside Dr
- 405 W 26th St
- 2409 W 24th Place
- 3053 Coal Mine Ave
- 1783 Anvil View Ave
- 1103 E 18th St
- 1663 Walnut
- 200 W 20th St Unit A142
- 200 W 20th St Unit E5
- 200 W 20th St Unit D20
- 200 W 20th St Unit A24
- 200 W 20th St Unit E6
- 200 W 20th St Unit A128
- 356 Columbine Dr
- 356 Columbine Dr Unit (available for purch
- 332 Columbine Dr
- 320 Columbine Dr
- 360 Columbine Dr
- 360 Columbine Dr Unit (available for purch
- 345 Columbine Dr
- 333 Columbine Dr
- 357 Columbine Dr
- 318 Columbine Dr
- 372 Columbine Dr
- TBD Acacia Ave
- 369 Columbine Dr
- 319 Columbine Dr
- 350 Evergreen Dr
- 348 Evergreen Dr
- 316 Columbine Dr
- 362 Evergreen Dr
- 376 Columbine Dr
- 336 Evergreen Dr