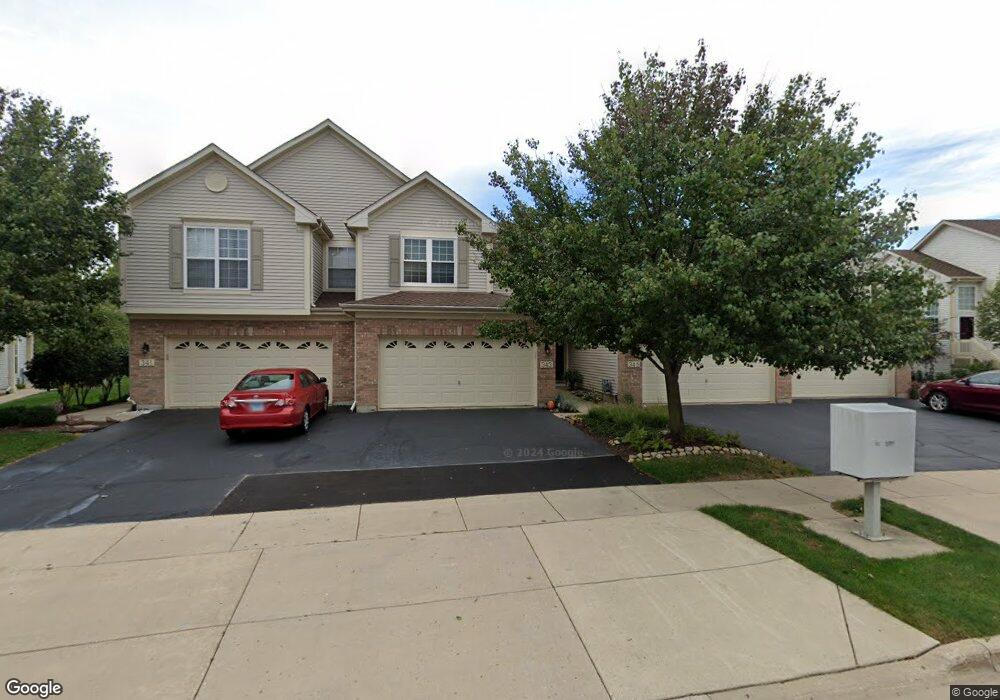
345 Emerald Ln Unit 53 Algonquin, IL 60102
Estimated Value: $308,000 - $312,000
2
Beds
--
Bath
1,610
Sq Ft
$193/Sq Ft
Est. Value
About This Home
This home is located at 345 Emerald Ln Unit 53, Algonquin, IL 60102 and is currently estimated at $310,125, approximately $192 per square foot. 345 Emerald Ln Unit 53 is a home located in Kane County with nearby schools including Algonquin Lakes Elementary School, Algonquin Middle School, and Dundee-Crown High School.
Ownership History
Date
Name
Owned For
Owner Type
Purchase Details
Closed on
Nov 22, 2024
Sold by
Kozlov Georgiy P and Kozlov Denis
Bought by
Nagonski Patrick and Nagonski Anna
Current Estimated Value
Home Financials for this Owner
Home Financials are based on the most recent Mortgage that was taken out on this home.
Original Mortgage
$284,905
Outstanding Balance
$282,503
Interest Rate
6.99%
Mortgage Type
New Conventional
Estimated Equity
$27,622
Purchase Details
Closed on
Jul 28, 2016
Sold by
Khoury Rebecca K and Khoury Ihab S
Bought by
Kozlov Gcorgiy P and Kozlov Denis
Purchase Details
Closed on
Feb 18, 2004
Sold by
Khoury Ihab S
Bought by
Khoury Ihab S and Keenan Rebecca
Purchase Details
Closed on
Jun 24, 2002
Sold by
Realen Homes Lp
Bought by
Khoury Ihab S
Home Financials for this Owner
Home Financials are based on the most recent Mortgage that was taken out on this home.
Original Mortgage
$157,300
Interest Rate
6.82%
Create a Home Valuation Report for This Property
The Home Valuation Report is an in-depth analysis detailing your home's value as well as a comparison with similar homes in the area
Purchase History
| Date | Buyer | Sale Price | Title Company |
|---|---|---|---|
| Nagonski Patrick | $300,000 | Cambridge Title | |
| Kozlov Gcorgiy P | $147,500 | Attorneys Title Guaranty Fun | |
| Khoury Ihab S | -- | -- | |
| Khoury Ihab S | $197,000 | Chicago Title Insurance Co |
Source: Public Records
Mortgage History
| Date | Status | Borrower | Loan Amount |
|---|---|---|---|
| Open | Nagonski Patrick | $284,905 | |
| Previous Owner | Khoury Ihab S | $157,300 | |
| Closed | Khoury Ihab S | $19,600 |
Source: Public Records
Tax History
| Year | Tax Paid | Tax Assessment Tax Assessment Total Assessment is a certain percentage of the fair market value that is determined by local assessors to be the total taxable value of land and additions on the property. | Land | Improvement |
|---|---|---|---|---|
| 2024 | $3,574 | $79,139 | $8,371 | $70,768 |
| 2023 | $3,826 | $71,207 | $7,532 | $63,675 |
| 2022 | $4,785 | $68,262 | $7,532 | $60,730 |
| 2021 | $4,484 | $64,453 | $7,112 | $57,341 |
| 2020 | $4,505 | $63,004 | $6,952 | $56,052 |
| 2019 | $4,334 | $59,811 | $6,600 | $53,211 |
| 2018 | $4,129 | $55,781 | $6,469 | $49,312 |
| 2017 | $3,915 | $52,180 | $6,051 | $46,129 |
| 2016 | $4,495 | $50,523 | $5,859 | $44,664 |
| 2015 | -- | $47,342 | $5,490 | $41,852 |
| 2014 | -- | $42,729 | $5,338 | $37,391 |
| 2013 | -- | $44,037 | $5,501 | $38,536 |
Source: Public Records
Map
Nearby Homes
- 2150 E Algonquin Rd
- 1923 Ozark Pkwy
- 2027 Teton Pkwy
- Lot 4 b Ryan Pkwy
- 1770 E Algonquin Rd
- 1906 Ozark Pkwy
- 1782 Cumberland Pkwy
- 2 Cumberland Pkwy
- 1321 Big Sur Pkwy
- 1551 Glacier Trail Unit 644
- 1420 Greenridge Ave
- 1670 Yosemite Pkwy
- 2260 Indigo Dr
- 1551 Glacier Pkwy
- 6526 Marble Ln Unit 1033
- 2332 Flagstone Ln Unit 26
- 1303 Silverstone Dr Unit 1302
- 1361 Yosemite Pkwy
- 417 Silverstone Dr Unit 417
- 2113 Elgin Rd
- 357 Emerald Ln Unit 64
- 381 Emerald Ln
- 325 Emerald Ln Unit 33
- 363 Emerald Ln Unit 7/2
- 347 Emerald Ln Unit 4
- 335 Emerald Ln Unit 43
- 377 Emerald Ln Unit 84
- 327 Emerald Ln
- 321 Emerald Ln Unit 31
- 367 Emerald Ln Unit 74
- 343 Emerald Ln Unit 5/2
- 331 Emerald Ln Unit 41
- 341 Emerald Ln Unit 5/1
- 323 Emerald Ln Unit 32
- 353 Emerald Ln Unit 62
- 385 Emerald Ln Unit 93
- 313 Emerald Ln Unit 22
- 355 Emerald Ln Unit 6/3
- 337 Emerald Ln Unit 44
- 383 Emerald Ln Unit 9/2