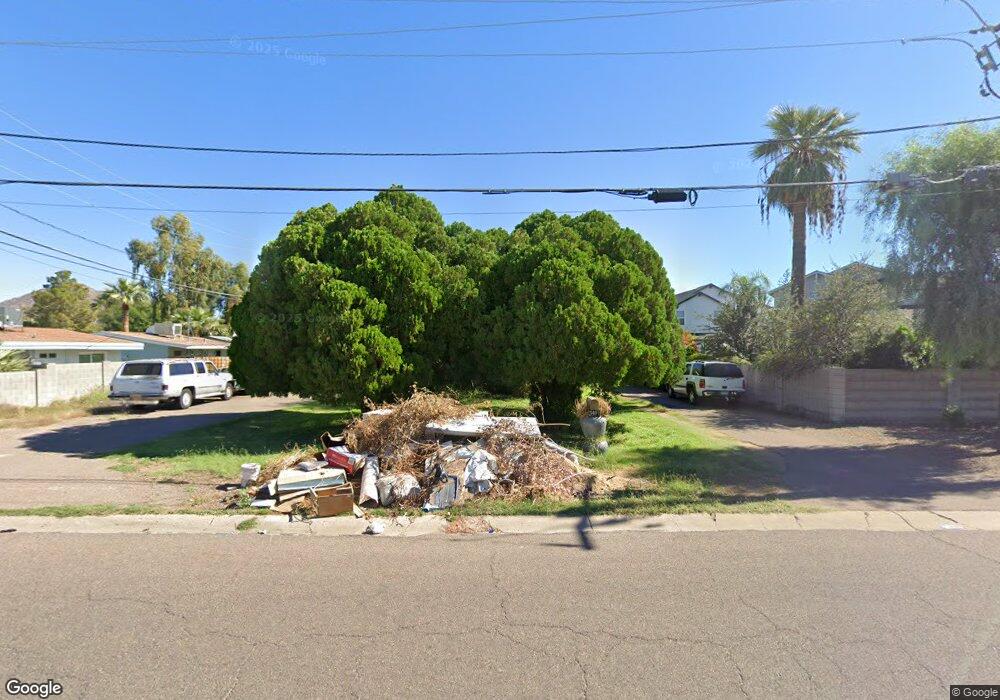
3451 N 38th St Phoenix, AZ 85018
Camelback East Village NeighborhoodEstimated Value: $759,000 - $1,042,000
--
Bed
--
Bath
800
Sq Ft
$1,145/Sq Ft
Est. Value
About This Home
This home is located at 3451 N 38th St, Phoenix, AZ 85018 and is currently estimated at $916,396, approximately $1,145 per square foot. 3451 N 38th St is a home with nearby schools including Monte Vista Elementary School, Camelback High School, and Phoenix Coding Academy.
Ownership History
Date
Name
Owned For
Owner Type
Purchase Details
Closed on
Aug 17, 2018
Sold by
Klecka Dawn
Bought by
Augusta Dawn Marie
Current Estimated Value
Purchase Details
Closed on
Jun 20, 2011
Sold by
Klecka Brian
Bought by
Klecka Dawn
Purchase Details
Closed on
Jun 7, 2001
Sold by
Silva Raymond and Silva Rosa Maria
Bought by
Klecka Brian and Klecka Dawn
Home Financials for this Owner
Home Financials are based on the most recent Mortgage that was taken out on this home.
Original Mortgage
$176,250
Interest Rate
7.14%
Mortgage Type
FHA
Purchase Details
Closed on
Jul 19, 1996
Sold by
Guerrero Jose and Guerrero Migdalia
Bought by
Silva Raymond and Silva Rosa Maria
Home Financials for this Owner
Home Financials are based on the most recent Mortgage that was taken out on this home.
Original Mortgage
$82,618
Interest Rate
8.32%
Mortgage Type
FHA
Purchase Details
Closed on
Nov 27, 1995
Sold by
Killeen Shirley A
Bought by
Killeen Shirley Ann and Shirley Ann Killeen Living Tru
Create a Home Valuation Report for This Property
The Home Valuation Report is an in-depth analysis detailing your home's value as well as a comparison with similar homes in the area
Home Values in the Area
Average Home Value in this Area
Purchase History
| Date | Buyer | Sale Price | Title Company |
|---|---|---|---|
| Augusta Dawn Marie | -- | None Available | |
| Klecka Dawn | -- | None Available | |
| Klecka Brian | $181,000 | Transnation Title Insurance | |
| Klecka Brian | -- | Transnation Title Insurance | |
| Silva Raymond | $83,000 | Chicago Title Insurance Co | |
| Killeen Shirley Ann | -- | -- |
Source: Public Records
Mortgage History
| Date | Status | Borrower | Loan Amount |
|---|---|---|---|
| Previous Owner | Klecka Brian | $176,250 | |
| Previous Owner | Silva Raymond | $82,618 |
Source: Public Records
Tax History Compared to Growth
Tax History
| Year | Tax Paid | Tax Assessment Tax Assessment Total Assessment is a certain percentage of the fair market value that is determined by local assessors to be the total taxable value of land and additions on the property. | Land | Improvement |
|---|---|---|---|---|
| 2025 | $2,775 | $20,541 | -- | -- |
| 2024 | $2,455 | $19,563 | -- | -- |
| 2023 | $2,455 | $46,010 | $9,200 | $36,810 |
| 2022 | $2,354 | $34,360 | $6,870 | $27,490 |
| 2021 | $2,428 | $33,460 | $6,690 | $26,770 |
| 2020 | $2,367 | $32,800 | $6,560 | $26,240 |
| 2019 | $2,352 | $22,830 | $4,560 | $18,270 |
| 2018 | $2,302 | $20,650 | $4,130 | $16,520 |
| 2017 | $2,210 | $18,060 | $3,610 | $14,450 |
| 2016 | $2,122 | $16,550 | $3,310 | $13,240 |
| 2015 | $1,976 | $13,220 | $2,640 | $10,580 |
Source: Public Records
Map
Nearby Homes
- 3618 N 38th St Unit 3
- 3640 N 38th St Unit 205
- 3849 E Crittenden Ln
- 3912 E Crittenden Ln
- 3401 N 37th St Unit 14
- 3703 E Mitchell Dr
- 3901 E Weldon Ave
- 3834 E Clarendon Ave
- 3917 E Weldon Ave
- 3739 E Fairmount Ave
- 3919 E Sheila Ln
- 3507 N 39th Place
- 3221 N 37th St Unit 26
- 3907 E Mulberry Dr
- 3628 E Clarendon Ave
- 3201 N 38th St Unit 2
- 3415 N 36th St Unit 3
- 3720 N 40th Place
- 4002 E Clarendon Ave
- 3136 N 38th St Unit 10
- 3601 N 38th St Unit 2
- 3601 N 38th St Unit 4
- 3601 N 38th St Unit 5
- 3601 N 38th St Unit 3
- 3601 N 38th St
- 3810 E Crittenden Ln
- 3441 N 38th St
- 3814 E Crittenden Ln
- 3439 N 38th St
- 3821 E Whitton Ave
- 3437 N 38th Place
- 3618 N St Unit 14
- 3437 N 38th Place
- 3618 N 38th (1) St Unit 1
- 3816 E Whitton Ave
- 3830 E Crittenden Ln
- 3433 N 38th Place
- 3827 E Whitton Ave
- 3618 N 38th (2) St Unit 2
- 3618 N 38th (12) St Unit 12