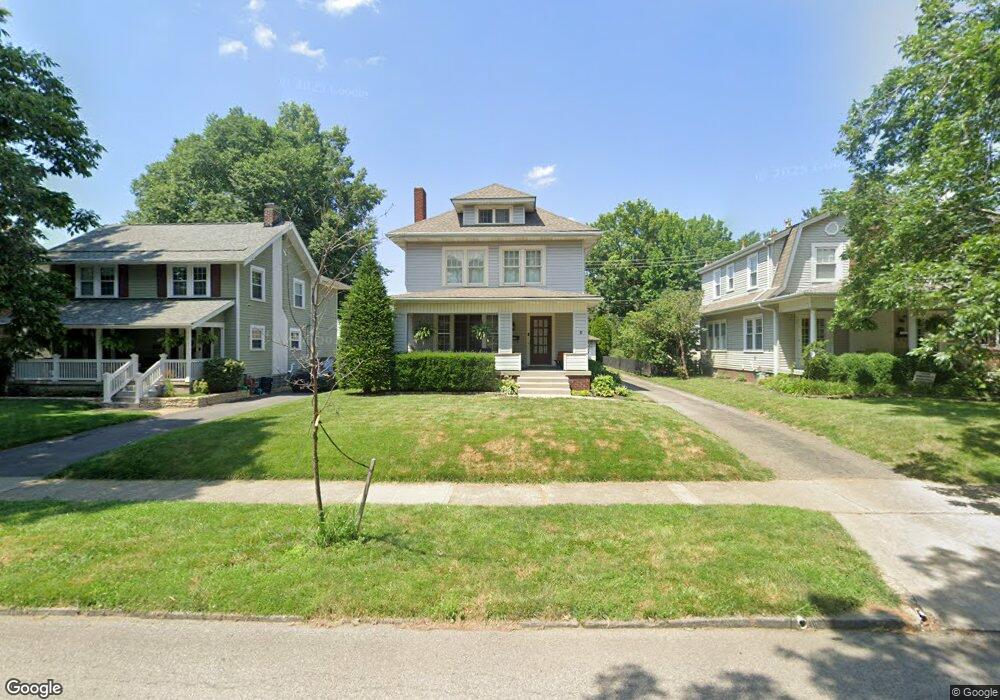
346 Oakland Park Ave Columbus, OH 43214
Clintonville NeighborhoodEstimated Value: $443,000 - $508,000
3
Beds
1
Bath
1,644
Sq Ft
$288/Sq Ft
Est. Value
About This Home
This home is located at 346 Oakland Park Ave, Columbus, OH 43214 and is currently estimated at $474,057, approximately $288 per square foot. 346 Oakland Park Ave is a home located in Franklin County with nearby schools including Clinton Elementary School, Dominion Middle School, and Whetstone High School.
Ownership History
Date
Name
Owned For
Owner Type
Purchase Details
Closed on
Apr 8, 2016
Sold by
Moore George Thomas
Bought by
Moore George Thomas and Moore Melinda A
Current Estimated Value
Home Financials for this Owner
Home Financials are based on the most recent Mortgage that was taken out on this home.
Original Mortgage
$207,000
Outstanding Balance
$164,233
Interest Rate
3.64%
Mortgage Type
New Conventional
Estimated Equity
$309,824
Purchase Details
Closed on
Apr 15, 2008
Sold by
Warne David B and Thurman R Warne Intervivos Tru
Bought by
Moore George Thomas
Home Financials for this Owner
Home Financials are based on the most recent Mortgage that was taken out on this home.
Original Mortgage
$148,800
Interest Rate
5.37%
Mortgage Type
Purchase Money Mortgage
Purchase Details
Closed on
Jul 5, 2000
Sold by
Warne Thurman R
Bought by
Warne Thurman R and Thurman R Warne Intervivos Tru
Purchase Details
Closed on
Jan 5, 1990
Bought by
Warne Thurman R
Create a Home Valuation Report for This Property
The Home Valuation Report is an in-depth analysis detailing your home's value as well as a comparison with similar homes in the area
Home Values in the Area
Average Home Value in this Area
Purchase History
| Date | Buyer | Sale Price | Title Company |
|---|---|---|---|
| Moore George Thomas | -- | None Available | |
| Moore George Thomas | $186,000 | Valmer Land | |
| Warne Thurman R | -- | -- | |
| Warne Thurman R | -- | -- |
Source: Public Records
Mortgage History
| Date | Status | Borrower | Loan Amount |
|---|---|---|---|
| Open | Moore George Thomas | $207,000 | |
| Closed | Moore George Thomas | $148,800 |
Source: Public Records
Tax History Compared to Growth
Tax History
| Year | Tax Paid | Tax Assessment Tax Assessment Total Assessment is a certain percentage of the fair market value that is determined by local assessors to be the total taxable value of land and additions on the property. | Land | Improvement |
|---|---|---|---|---|
| 2024 | $6,254 | $139,340 | $57,120 | $82,220 |
| 2023 | $6,174 | $139,335 | $57,120 | $82,215 |
| 2022 | $6,764 | $130,410 | $37,240 | $93,170 |
| 2021 | $6,776 | $130,410 | $37,240 | $93,170 |
| 2020 | $6,784 | $130,410 | $37,240 | $93,170 |
| 2019 | $6,120 | $100,880 | $28,670 | $72,210 |
| 2018 | $3,053 | $100,880 | $28,670 | $72,210 |
| 2017 | $5,817 | $100,880 | $28,670 | $72,210 |
| 2016 | $5,519 | $83,310 | $31,820 | $51,490 |
| 2015 | $2,505 | $83,310 | $31,820 | $51,490 |
| 2014 | $5,022 | $83,310 | $31,820 | $51,490 |
| 2013 | $2,359 | $79,345 | $30,310 | $49,035 |
Source: Public Records
Map
Nearby Homes
- 467 Brevoort Rd
- 419 E North Broadway St
- 455 Walhalla Rd
- 219 E Como Ave
- 217 Arden Rd
- 540 Fallis Rd
- 296 Walhalla Rd
- 569 Walhalla Rd
- 374 Acton Rd
- 36 Brighton Rd
- 612 E Como Ave
- 541 Northridge Rd
- 3386 Beulah Rd
- 180 Tibet Rd
- 88 W Kenworth Rd
- 3726 N High St
- 45 E California Ave
- 39 W Lakeview Ave
- 44 W Pacemont Rd
- 15 W California Ave
- 340 Oakland Park Ave
- 354 Oakland Park Ave
- 334 Oakland Park Ave
- 360 Oakland Park Ave
- 366 Oakland Park Ave
- 328 Oakland Park Ave
- 355 E Dunedin Rd
- 349 E Dunedin Rd
- 361 E Dunedin Rd
- 341 E Dunedin Rd
- 367 E Dunedin Rd
- 341 Oakland Park Ave
- 349 Oakland Park Ave
- 372 Oakland Park Ave
- 320 Oakland Park Ave
- 355 Oakland Park Ave
- 335 Oakland Park Ave
- 375 E Dunedin Rd
- 335 E Dunedin Rd
- 361 Oakland Park Ave