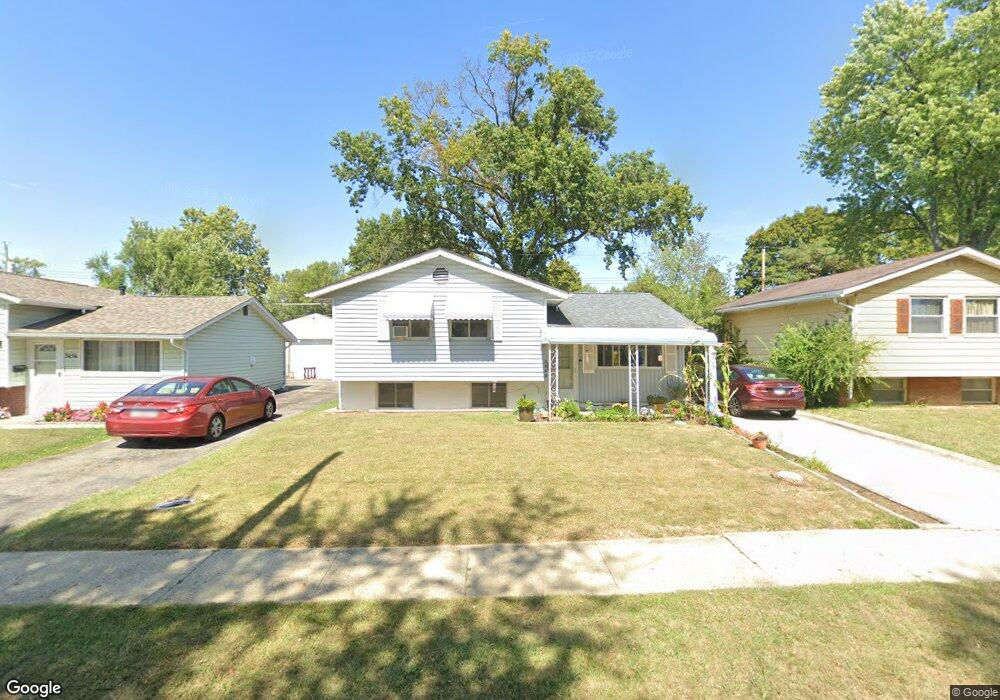
3460 Binbrook Rd N Columbus, OH 43227
Linwood NeighborhoodEstimated Value: $172,000 - $251,000
3
Beds
1
Bath
1,344
Sq Ft
$152/Sq Ft
Est. Value
About This Home
This home is located at 3460 Binbrook Rd N, Columbus, OH 43227 and is currently estimated at $203,739, approximately $151 per square foot. 3460 Binbrook Rd N is a home located in Franklin County with nearby schools including Scottwood Elementary School, Johnson Park Middle School, and Walnut Ridge High School.
Ownership History
Date
Name
Owned For
Owner Type
Purchase Details
Closed on
Dec 5, 2019
Sold by
Austin John O and Daniels Janice
Bought by
Landaverde Emelina Rosales
Current Estimated Value
Home Financials for this Owner
Home Financials are based on the most recent Mortgage that was taken out on this home.
Original Mortgage
$111,935
Outstanding Balance
$97,358
Interest Rate
3.37%
Mortgage Type
FHA
Estimated Equity
$106,381
Purchase Details
Closed on
Apr 25, 2007
Sold by
Beneficial Ohio Inc
Bought by
Austin John O and Daniels Austin Janice
Home Financials for this Owner
Home Financials are based on the most recent Mortgage that was taken out on this home.
Original Mortgage
$44,000
Interest Rate
6.21%
Mortgage Type
Purchase Money Mortgage
Purchase Details
Closed on
Jan 19, 2007
Sold by
Gillyard Billy L and Case #06Cve04 5642
Bought by
Beneficial Ohio Inc and Beneficial Mortgage Co
Purchase Details
Closed on
Mar 22, 1971
Bought by
Gillyard Billy L
Create a Home Valuation Report for This Property
The Home Valuation Report is an in-depth analysis detailing your home's value as well as a comparison with similar homes in the area
Home Values in the Area
Average Home Value in this Area
Purchase History
| Date | Buyer | Sale Price | Title Company |
|---|---|---|---|
| Landaverde Emelina Rosales | $114,000 | Valmer Land Title | |
| Austin John O | $55,000 | Foundation | |
| Beneficial Ohio Inc | $56,000 | Foundation | |
| Gillyard Billy L | -- | -- |
Source: Public Records
Mortgage History
| Date | Status | Borrower | Loan Amount |
|---|---|---|---|
| Open | Landaverde Emelina Rosales | $111,935 | |
| Previous Owner | Austin John O | $44,000 |
Source: Public Records
Tax History
| Year | Tax Paid | Tax Assessment Tax Assessment Total Assessment is a certain percentage of the fair market value that is determined by local assessors to be the total taxable value of land and additions on the property. | Land | Improvement |
|---|---|---|---|---|
| 2025 | $2,256 | $50,260 | $11,900 | $38,360 |
| 2024 | $2,256 | $50,260 | $11,900 | $38,360 |
| 2023 | $2,227 | $50,260 | $11,900 | $38,360 |
| 2022 | $1,877 | $36,190 | $6,300 | $29,890 |
| 2021 | $1,880 | $36,190 | $6,300 | $29,890 |
| 2020 | $1,883 | $36,190 | $6,300 | $29,890 |
| 2019 | $1,384 | $22,820 | $5,250 | $17,570 |
| 2018 | $1,273 | $22,820 | $5,250 | $17,570 |
| 2017 | $1,333 | $22,820 | $5,250 | $17,570 |
| 2016 | $1,282 | $19,360 | $4,060 | $15,300 |
| 2015 | $1,164 | $19,360 | $4,060 | $15,300 |
| 2014 | $1,167 | $19,360 | $4,060 | $15,300 |
| 2013 | $640 | $21,525 | $4,515 | $17,010 |
Source: Public Records
Map
Nearby Homes
- 3428 LIV Moor Dr
- 3325 E Deshler Ave
- 1836 Penfield Ct S
- 3285 Scottwood Rd
- 1619 Basil Dr
- 3777 E Deshler Ave
- 3622 Cushing Dr Unit C
- 3064 Niagara Ct E
- 1353 Barnett Rd
- 1559 Vilardo Ln
- 1679 Penfield Rd
- 1792 Bostwick Rd
- 1656 Vilardo Ln
- 2251 Meridian Ct
- 1637 S James Rd
- 2275 Cardston Ct
- 1640 Striebel Rd
- 3038 Wadsworth Ct
- 3036 Wadsworth Ct
- 0 Rotunda Dr Unit 271
- 3466 Binbrook Rd N
- 3454 Binbrook Rd N
- 3474 Binbrook Rd N
- 3448 Binbrook Rd N
- 3461 Binbrook Rd N
- 3480 Binbrook Rd N
- 3440 Binbrook Rd N
- 3453 E Deshler Ave
- 3447 E Deshler Ave
- 3461 E Deshler Ave
- 3471 Binbrook Rd N
- 3467 E Deshler Ave
- 3431 E Deshler Ave
- 3486 Binbrook Rd N
- 3434 Binbrook Rd N
- 3439 Binbrook Rd N
- 3477 Binbrook Rd N
- 3473 E Deshler Ave
- 3425 E Deshler Ave
Your Personal Tour Guide
Ask me questions while you tour the home.