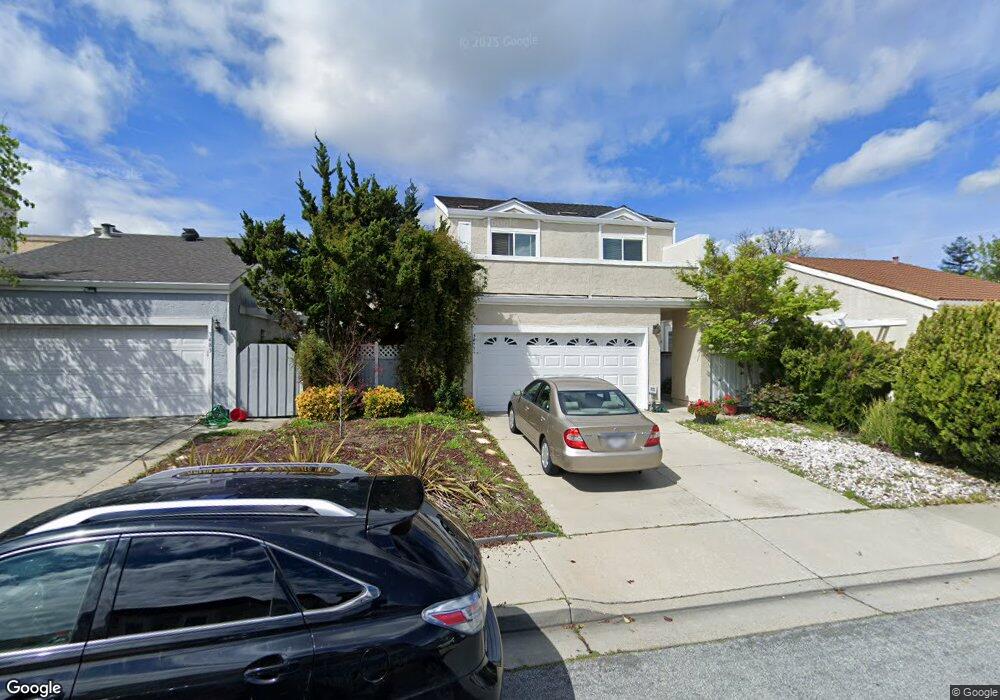
3477 Lapridge Ln San Jose, CA 95124
Cambrian NeighborhoodEstimated Value: $1,529,000 - $1,957,000
4
Beds
3
Baths
1,595
Sq Ft
$1,073/Sq Ft
Est. Value
About This Home
This home is located at 3477 Lapridge Ln, San Jose, CA 95124 and is currently estimated at $1,712,104, approximately $1,073 per square foot. 3477 Lapridge Ln is a home located in Santa Clara County with nearby schools including Leigh High School, Branham High School, and Farnham Elementary School.
Ownership History
Date
Name
Owned For
Owner Type
Purchase Details
Closed on
Nov 6, 2012
Sold by
Sethi Shobhit and Jain Nanda
Bought by
Sethi Shobhit and Jain Nanda
Current Estimated Value
Home Financials for this Owner
Home Financials are based on the most recent Mortgage that was taken out on this home.
Original Mortgage
$260,000
Outstanding Balance
$46,046
Interest Rate
3.34%
Mortgage Type
New Conventional
Estimated Equity
$1,666,058
Purchase Details
Closed on
Jan 13, 2011
Sold by
Sethi Shobhit and Jain Nanda
Bought by
Sethi Shobhit and Jain Nanda
Purchase Details
Closed on
Mar 8, 2000
Sold by
David Gunawan and Tan Gene S And Theresia S
Bought by
Sethi Shobhit and Jain Nanda
Home Financials for this Owner
Home Financials are based on the most recent Mortgage that was taken out on this home.
Original Mortgage
$308,000
Interest Rate
7.87%
Create a Home Valuation Report for This Property
The Home Valuation Report is an in-depth analysis detailing your home's value as well as a comparison with similar homes in the area
Home Values in the Area
Average Home Value in this Area
Purchase History
| Date | Buyer | Sale Price | Title Company |
|---|---|---|---|
| Sethi Shobhit | -- | Old Republic Title Company | |
| Sethi Shobhit | -- | Old Republic Title Company | |
| Sethi Shobhit | -- | None Available | |
| Sethi Shobhit | $385,000 | Old Republic Title Company |
Source: Public Records
Mortgage History
| Date | Status | Borrower | Loan Amount |
|---|---|---|---|
| Open | Sethi Shobhit | $260,000 | |
| Closed | Sethi Shobhit | $308,000 | |
| Closed | Sethi Shobhit | $38,500 |
Source: Public Records
Tax History Compared to Growth
Tax History
| Year | Tax Paid | Tax Assessment Tax Assessment Total Assessment is a certain percentage of the fair market value that is determined by local assessors to be the total taxable value of land and additions on the property. | Land | Improvement |
|---|---|---|---|---|
| 2025 | $8,733 | $591,711 | $266,192 | $325,519 |
| 2024 | $8,733 | $580,110 | $260,973 | $319,137 |
| 2023 | $8,733 | $568,736 | $255,856 | $312,880 |
| 2022 | $8,497 | $557,586 | $250,840 | $306,746 |
| 2021 | $8,302 | $546,654 | $245,922 | $300,732 |
| 2020 | $7,920 | $541,050 | $243,401 | $297,649 |
| 2019 | $7,809 | $530,442 | $238,629 | $291,813 |
| 2018 | $7,594 | $520,042 | $233,950 | $286,092 |
| 2017 | $7,421 | $509,846 | $229,363 | $280,483 |
| 2016 | $7,070 | $499,850 | $224,866 | $274,984 |
| 2015 | $6,982 | $492,343 | $221,489 | $270,854 |
| 2014 | $6,462 | $482,700 | $217,151 | $265,549 |
Source: Public Records
Map
Nearby Homes
- 3489 Wine Barrel Way
- 2264 Shelley Ave
- 3461 Wine Cask Way
- 201 Shelley Ave
- 3659 S Bascom Ave
- 116 Monte Villa Ct
- 101 Redding Rd Unit A4
- 1500 Camden Ave
- 3949 Starview Dr
- 1040 Longfellow Ave
- 2088 Cully Place
- 2985 Lantz Ave
- 2265 Sun Glory Ln Unit A
- 14566 S Bascom Ave
- 2888 Lantz Ave
- 2867 S Bascom Ave Unit 606
- 2785 S Bascom Ave Unit 26
- 4593 Fallstone Ct
- 3335 Jennifer Way
- 16157 E Mozart Ave
- 3483 Lapridge Ln
- 3471 Lapridge Ln
- 2375 Mount Davidson Dr
- 2381 Mount Davidson Dr
- 2369 Mount Davidson Dr
- 2387 Mount Davidson Dr
- 2393 Mount Davidson Dr
- 3476 Lapridge Ln
- 3470 Lapridge Ln
- 3482 Lapridge Ln
- 2359 Mount Davidson Dr
- 2363 Shelley Ave
- 2353 Mount Davidson Dr
- 2357 Shelley Ave
- 2347 Mount Davidson Dr
- 3508 Mount Davidson Ct
- 2344 Shelley Ave
- 3507 Mccoppin Park Ct
- 2351 Shelley Ave
- 2341 Mount Davidson Dr