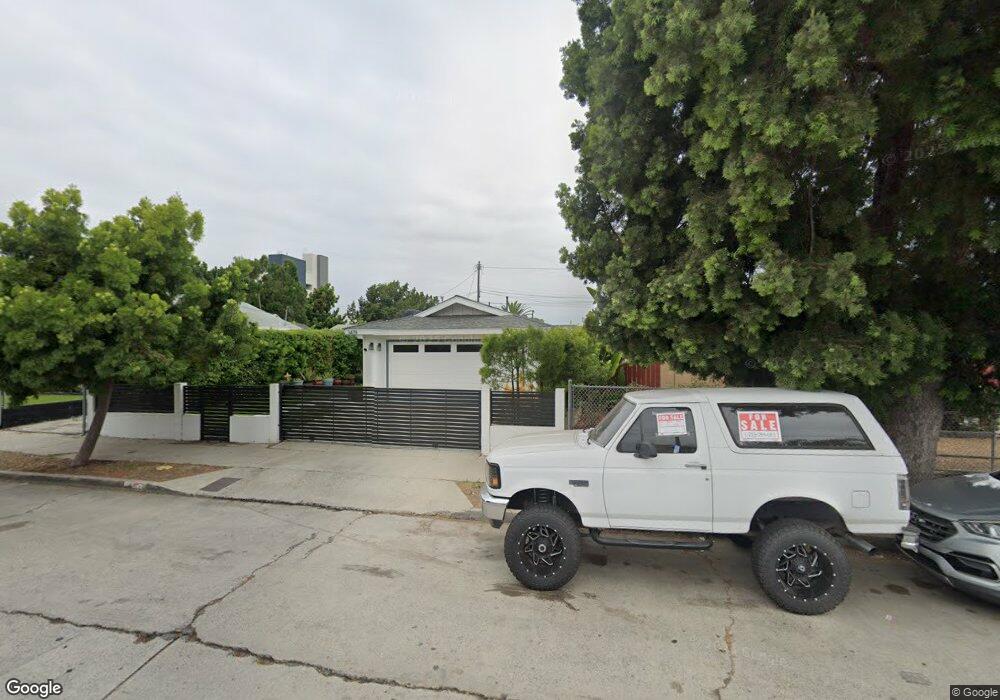
3479 W 67th St Los Angeles, CA 90043
Hyde Park NeighborhoodEstimated Value: $927,693 - $1,245,000
5
Beds
2
Baths
1,692
Sq Ft
$614/Sq Ft
Est. Value
About This Home
This home is located at 3479 W 67th St, Los Angeles, CA 90043 and is currently estimated at $1,038,673, approximately $613 per square foot. 3479 W 67th St is a home located in Los Angeles County with nearby schools including Yes Academy, Horace Mann Ucla Community, and Crenshaw Science, Technology, Engineering, Math And Medicine Magnet.
Ownership History
Date
Name
Owned For
Owner Type
Purchase Details
Closed on
Jul 13, 2020
Sold by
Five Star Family Homes Llc
Bought by
Shaw Sylvia and Shaw James E
Current Estimated Value
Home Financials for this Owner
Home Financials are based on the most recent Mortgage that was taken out on this home.
Original Mortgage
$443,750
Outstanding Balance
$392,610
Interest Rate
3.1%
Mortgage Type
New Conventional
Estimated Equity
$646,063
Purchase Details
Closed on
Jan 21, 2020
Sold by
Stewart Latricia and Branch Winsome
Bought by
Five Star Family Homes Llc and Socal Homes La Llc
Purchase Details
Closed on
Oct 14, 2014
Sold by
Hogart Susan
Bought by
Stewart Latricia and Branch Winsome
Purchase Details
Closed on
Sep 17, 2010
Sold by
Stewart Aldwyn G and Stewart Coleen E
Bought by
Hogart Susan and Stewart Latricia
Create a Home Valuation Report for This Property
The Home Valuation Report is an in-depth analysis detailing your home's value as well as a comparison with similar homes in the area
Home Values in the Area
Average Home Value in this Area
Purchase History
| Date | Buyer | Sale Price | Title Company |
|---|---|---|---|
| Shaw Sylvia | $781,000 | North American Title Co Inc | |
| Five Star Family Homes Llc | $510,000 | North American Title | |
| Stewart Latricia | -- | None Available | |
| Hogart Susan | -- | None Available |
Source: Public Records
Mortgage History
| Date | Status | Borrower | Loan Amount |
|---|---|---|---|
| Open | Shaw Sylvia | $443,750 |
Source: Public Records
Tax History Compared to Growth
Tax History
| Year | Tax Paid | Tax Assessment Tax Assessment Total Assessment is a certain percentage of the fair market value that is determined by local assessors to be the total taxable value of land and additions on the property. | Land | Improvement |
|---|---|---|---|---|
| 2025 | $10,260 | $845,376 | $567,625 | $277,751 |
| 2024 | $10,260 | $828,801 | $556,496 | $272,305 |
| 2023 | $10,066 | $812,551 | $545,585 | $266,966 |
| 2022 | $9,604 | $796,620 | $534,888 | $261,732 |
| 2021 | $9,474 | $781,000 | $524,400 | $256,600 |
| 2020 | $3,893 | $306,991 | $134,795 | $172,196 |
| 2019 | $3,746 | $300,972 | $132,152 | $168,820 |
| 2018 | $3,665 | $295,071 | $129,561 | $165,510 |
| 2016 | $3,490 | $283,615 | $124,531 | $159,084 |
| 2015 | $3,440 | $279,356 | $122,661 | $156,695 |
| 2014 | $2,820 | $214,499 | $24,840 | $189,659 |
Source: Public Records
Map
Nearby Homes
- 6606 Brynhurst Ave
- 6550 Brynhurst Ave
- 6720 West Blvd
- 6519 Crenshaw Blvd
- 6736 West Blvd
- 6800 West Blvd
- 1142 E 66th St
- 6416 S Victoria Ave
- 6812 11th Ave
- 6411 West Blvd
- 6409 11th Ave
- 3473 W 63rd St
- 3304 W 63rd St
- 3201 W Florence Ave
- 6126 Brynhurst Ave
- 3120 W 71st St
- 1045 E Hyde Park Blvd
- 7323 Crenshaw Blvd
- 6121 Crenshaw Blvd
- 3626 W 62nd St
- 3479 W 67th St Unit 3479 12
- 3479 W 67th St Unit 3479 and a half
- 3479 W 67th St
- 3473 W 67th St
- 3481 W 67th St
- 3467 W 67th St
- 3483 W 67th St
- 6606 Brynhurst Ave Unit 6608 D
- 6606 Brynhurst Ave Unit 8
- 6606 Brynhurst Ave
- 3465 W 67th St
- 6602 Brynhurst Ave
- 6611 1/2 Brynhurst Ave Unit 6611
- 3461 W 67th St
- 6600 Brynhurst Ave
- 3486 W 67th St
- 3480 W 67th St
- 3488 W 67th St
- 3501 W 67th St
- 3478 W 67th St