Estimated Value: $1,268,000 - $1,303,894
4
Beds
4
Baths
2,252
Sq Ft
$570/Sq Ft
Est. Value
About This Home
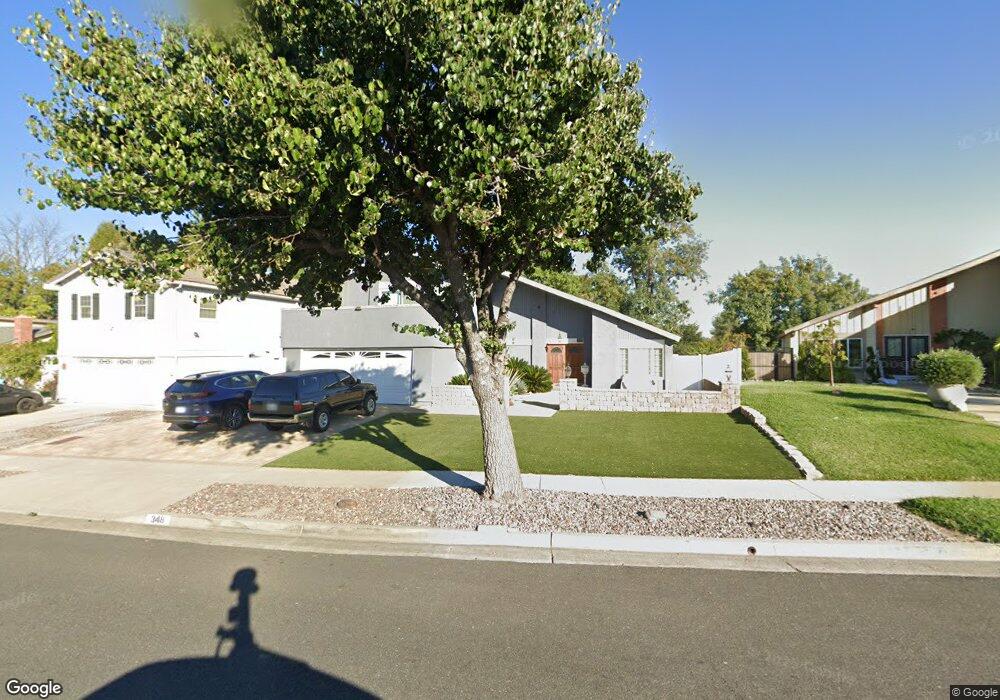
This home is located at 348 Devonshire Dr, Brea, CA 92821 and is currently estimated at $1,283,724, approximately $570 per square foot. 348 Devonshire Dr is a home located in Orange County with nearby schools including Brea Country Hills Elementary School, Brea Junior High School, and Brea-Olinda High School.
Ownership History
Date
Name
Owned For
Owner Type
Purchase Details
Closed on
Dec 29, 2021
Sold by
Hanano and Michelle
Bought by
Hanano Family Revocable Trust
Current Estimated Value
Purchase Details
Closed on
Mar 20, 2000
Sold by
Raymond Proctor and Raymond Theresa
Bought by
Hanano Richard and Hanano Michelle
Home Financials for this Owner
Home Financials are based on the most recent Mortgage that was taken out on this home.
Original Mortgage
$278,690
Interest Rate
8.24%
Purchase Details
Closed on
Jan 21, 1998
Sold by
Turner Richard C and Turner Jane
Bought by
Proctor Raymond and Proctor Theresa
Home Financials for this Owner
Home Financials are based on the most recent Mortgage that was taken out on this home.
Original Mortgage
$243,500
Interest Rate
6.97%
Mortgage Type
Seller Take Back
Create a Home Valuation Report for This Property
The Home Valuation Report is an in-depth analysis detailing your home's value as well as a comparison with similar homes in the area
Home Values in the Area
Average Home Value in this Area
Purchase History
| Date | Buyer | Sale Price | Title Company |
|---|---|---|---|
| Hanano Family Revocable Trust | -- | None Listed On Document | |
| Hanano Richard | $310,000 | Benefit Land Title Company | |
| Proctor Raymond | $265,000 | Orange Coast Title |
Source: Public Records
Mortgage History
| Date | Status | Borrower | Loan Amount |
|---|---|---|---|
| Previous Owner | Hanano Richard | $278,690 | |
| Previous Owner | Proctor Raymond | $243,500 |
Source: Public Records
Tax History
| Year | Tax Paid | Tax Assessment Tax Assessment Total Assessment is a certain percentage of the fair market value that is determined by local assessors to be the total taxable value of land and additions on the property. | Land | Improvement |
|---|---|---|---|---|
| 2025 | $5,682 | $499,507 | $334,294 | $165,213 |
| 2024 | $5,682 | $489,713 | $327,739 | $161,974 |
| 2023 | $5,524 | $480,111 | $321,312 | $158,799 |
| 2022 | $5,470 | $470,698 | $315,012 | $155,686 |
| 2021 | $5,367 | $461,469 | $308,835 | $152,634 |
| 2020 | $5,330 | $456,738 | $305,669 | $151,069 |
| 2019 | $5,187 | $447,783 | $299,676 | $148,107 |
| 2018 | $5,109 | $439,003 | $293,800 | $145,203 |
| 2017 | $5,011 | $430,396 | $288,040 | $142,356 |
| 2016 | $4,912 | $421,957 | $282,392 | $139,565 |
| 2015 | $4,842 | $415,619 | $278,150 | $137,469 |
| 2014 | $4,702 | $407,478 | $272,701 | $134,777 |
Source: Public Records
Map
Nearby Homes
- 136 Donnybrook Rd
- 2304 Carrotwood Dr
- 1796 Ravencrest Dr
- 2418 Rainbow Ln
- 2849 Tarragon Ct
- 2826 Lemonwood Ct
- 2851 Rolling Hills Dr Unit 178
- 2851 Rolling Hills Dr Unit 257
- 2851 Rolling Hills Dr Unit 248
- 2851 Rolling Hills Dr
- 213 Appalachian Cir
- 2583 Sandpebble Ln
- 206 Allegheny Cir
- 3054 Associated Rd Unit 20
- 2761 E Stearns St
- 520 N Bardsdale Place
- 570 Olive Ave
- 3000 Associated Rd Unit 60
- 2775 Pine Creek Cir Unit 116
- 2733 Quail Ridge Cir Unit 32
- 340 Devonshire Dr
- 356 Devonshire Dr
- 332 Devonshire Dr
- 364 Devonshire Dr
- 355 Devonshire Dr
- 345 Devonshire Dr
- 2140 Heather Ln
- 335 Devonshire Dr
- 324 Devonshire Dr
- 2130 Heather Ln
- 325 Devonshire Dr
- 354 Amberwick Ln
- 316 Devonshire Dr
- 344 Amberwick Ln
- 2110 Heather Ln
- 2141 Hillhaven Dr
- 334 Amberwick Ln
- 400 Devonshire Dr
- 315 Devonshire Dr
- 2131 Hillhaven Dr
Your Personal Tour Guide
Ask me questions while you tour the home.