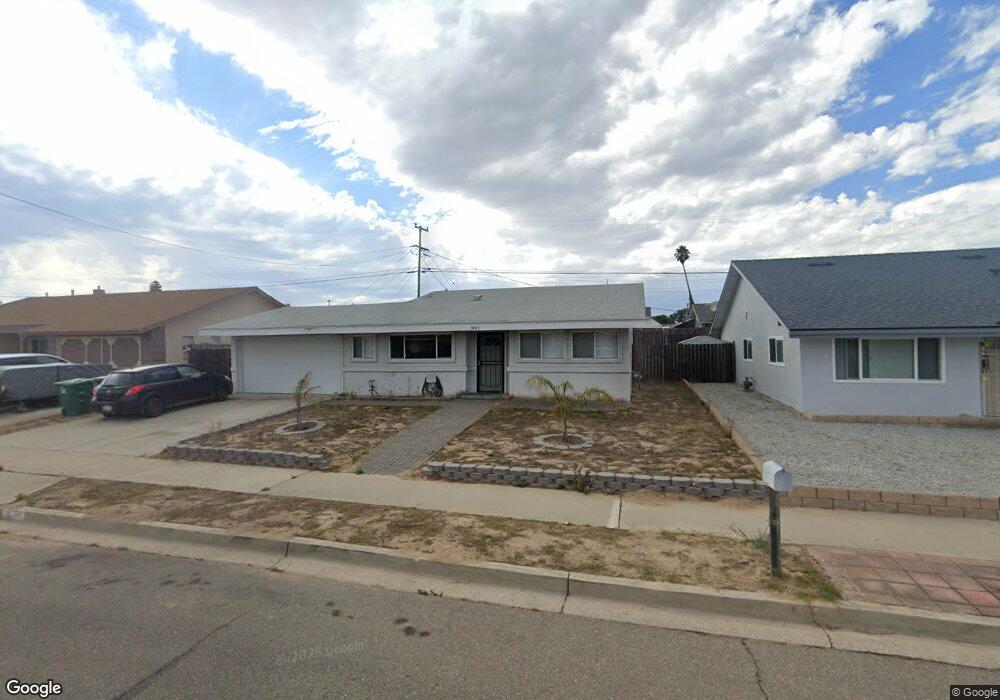
3483 Via Barba Lompoc, CA 93436
Mission Hills NeighborhoodEstimated Value: $528,881 - $579,000
3
Beds
2
Baths
1,247
Sq Ft
$443/Sq Ft
Est. Value
About This Home
This home is located at 3483 Via Barba, Lompoc, CA 93436 and is currently estimated at $551,970, approximately $442 per square foot. 3483 Via Barba is a home located in Santa Barbara County with nearby schools including Los Berros Visual and Performing Arts Academy, Cabrillo High School, and Olive Grove Charter - Lompoc.
Ownership History
Date
Name
Owned For
Owner Type
Purchase Details
Closed on
Oct 3, 2016
Sold by
Dalessandro Phillip A and Kmiecik David L
Bought by
Kmiecik David L
Current Estimated Value
Home Financials for this Owner
Home Financials are based on the most recent Mortgage that was taken out on this home.
Original Mortgage
$224,000
Outstanding Balance
$179,578
Interest Rate
3.46%
Mortgage Type
New Conventional
Estimated Equity
$372,392
Purchase Details
Closed on
May 16, 2013
Sold by
Zamora Diane K
Bought by
Dalessandro Phillip A and Kmiecik David L
Home Financials for this Owner
Home Financials are based on the most recent Mortgage that was taken out on this home.
Original Mortgage
$166,920
Interest Rate
3.5%
Mortgage Type
FHA
Purchase Details
Closed on
Feb 29, 2000
Sold by
Zamora Diane K
Bought by
Zamora Diane K
Home Financials for this Owner
Home Financials are based on the most recent Mortgage that was taken out on this home.
Original Mortgage
$86,500
Interest Rate
8.27%
Create a Home Valuation Report for This Property
The Home Valuation Report is an in-depth analysis detailing your home's value as well as a comparison with similar homes in the area
Home Values in the Area
Average Home Value in this Area
Purchase History
| Date | Buyer | Sale Price | Title Company |
|---|---|---|---|
| Kmiecik David L | -- | None Available | |
| Dalessandro Phillip A | $170,000 | First American Title Company | |
| Zamora Diane K | -- | Fidelity National Title Co |
Source: Public Records
Mortgage History
| Date | Status | Borrower | Loan Amount |
|---|---|---|---|
| Open | Kmiecik David L | $224,000 | |
| Previous Owner | Dalessandro Phillip A | $166,920 | |
| Previous Owner | Zamora Diane K | $86,500 |
Source: Public Records
Tax History Compared to Growth
Tax History
| Year | Tax Paid | Tax Assessment Tax Assessment Total Assessment is a certain percentage of the fair market value that is determined by local assessors to be the total taxable value of land and additions on the property. | Land | Improvement |
|---|---|---|---|---|
| 2025 | $2,856 | $264,241 | $106,926 | $157,315 |
| 2023 | $2,856 | $253,982 | $102,775 | $151,207 |
| 2022 | $2,808 | $249,003 | $100,760 | $148,243 |
| 2021 | $2,841 | $244,122 | $98,785 | $145,337 |
| 2020 | $2,810 | $241,620 | $97,773 | $143,847 |
| 2019 | $2,765 | $236,883 | $95,856 | $141,027 |
| 2018 | $2,723 | $232,239 | $93,977 | $138,262 |
| 2017 | $2,674 | $227,686 | $92,135 | $135,551 |
| 2016 | $2,081 | $176,837 | $72,814 | $104,023 |
| 2014 | $2,037 | $170,771 | $70,317 | $100,454 |
Source: Public Records
Map
Nearby Homes
- 3478 Via Cortez
- 3347 Via Cortez
- 3578 Via Lato
- 3632 Via Lato
- 1588 Calle Portos
- 1141 Pellham Dr
- 1320 Onstott Rd
- 1445 Calle Marana
- 3878 Via Mondo
- 832 Onstott Rd
- 3030 Silver Sage Ln
- 778 Tamarisk Dr
- 2611 N Highway 1
- 384 Falcon Crest Dr
- 298 Saint Andrews Way
- 3725 Jupiter Ave
- 561 Andromeda Dr
- 4021 Muirfield Place
- 579 Saint Andrews Way
- 3939 Saturn Ave
- 3477 Via Barba
- 3491 Via Barba
- 3484 Via Arnez
- 3478 Via Arnez
- 3492 Via Arnez
- 3467 Via Barba
- 3468 Via Arnez
- 3484 Via Barba
- 3492 Via Barba
- 3478 Via Barba
- 3461 Via Barba
- 3468 Via Barba
- 3460 Via Arnez Unit 1
- 1419 Calle Quarta
- 1427 Calle Quarta
- 1411 Calle Quarta
- 1435 Calle Quarta
- 3462 Via Barba Unit 1
- 1450 Calle Quarta
- 3453 Via Barba Unit 1