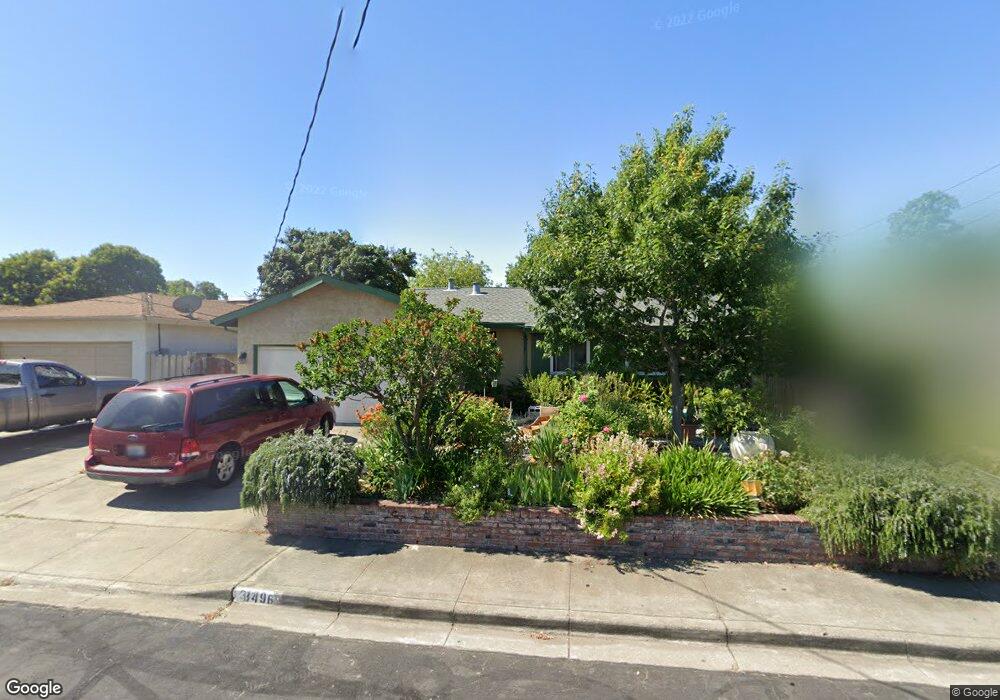
3496 Tanager Cir Concord, CA 94520
Sun Terrace NeighborhoodEstimated Value: $646,912 - $724,000
3
Beds
2
Baths
1,378
Sq Ft
$493/Sq Ft
Est. Value
About This Home
This home is located at 3496 Tanager Cir, Concord, CA 94520 and is currently estimated at $679,728, approximately $493 per square foot. 3496 Tanager Cir is a home located in Contra Costa County with nearby schools including Sun Terrace Elementary School, El Dorado Middle School, and Mt. Diablo High School.
Ownership History
Date
Name
Owned For
Owner Type
Purchase Details
Closed on
Apr 20, 2015
Sold by
Goodness Lyn J
Bought by
Goodness Lyn Jane
Current Estimated Value
Purchase Details
Closed on
Jan 19, 2012
Sold by
Goodness Daniel E
Bought by
Goodness Lyn J
Purchase Details
Closed on
Nov 3, 2009
Sold by
Goodness Daniel E and Goodness Lyn J
Bought by
Goodness Lyn J and Goodness Daniel E
Home Financials for this Owner
Home Financials are based on the most recent Mortgage that was taken out on this home.
Original Mortgage
$232,750
Outstanding Balance
$151,354
Interest Rate
4.92%
Mortgage Type
New Conventional
Estimated Equity
$528,374
Purchase Details
Closed on
Aug 28, 2000
Sold by
Conners Sharon M
Bought by
Goodness Daniel E and Goodness Lyn J
Home Financials for this Owner
Home Financials are based on the most recent Mortgage that was taken out on this home.
Original Mortgage
$224,448
Interest Rate
8.2%
Mortgage Type
FHA
Create a Home Valuation Report for This Property
The Home Valuation Report is an in-depth analysis detailing your home's value as well as a comparison with similar homes in the area
Home Values in the Area
Average Home Value in this Area
Purchase History
| Date | Buyer | Sale Price | Title Company |
|---|---|---|---|
| Goodness Lyn Jane | -- | None Available | |
| Goodness Lyn J | -- | None Available | |
| Goodness Lyn J | -- | Chicago Title Company | |
| Goodness Daniel E | $226,000 | Fidelity National Title Co |
Source: Public Records
Mortgage History
| Date | Status | Borrower | Loan Amount |
|---|---|---|---|
| Open | Goodness Lyn J | $232,750 | |
| Closed | Goodness Daniel E | $224,448 |
Source: Public Records
Tax History
| Year | Tax Paid | Tax Assessment Tax Assessment Total Assessment is a certain percentage of the fair market value that is determined by local assessors to be the total taxable value of land and additions on the property. | Land | Improvement |
|---|---|---|---|---|
| 2025 | $4,768 | $340,372 | $150,673 | $189,699 |
| 2024 | $4,536 | $333,699 | $147,719 | $185,980 |
| 2023 | $4,536 | $327,157 | $144,823 | $182,334 |
| 2022 | $4,462 | $320,743 | $141,984 | $178,759 |
| 2021 | $4,342 | $314,454 | $139,200 | $175,254 |
| 2019 | $4,251 | $305,128 | $135,072 | $170,056 |
| 2018 | $4,083 | $299,146 | $132,424 | $166,722 |
| 2017 | $3,939 | $293,281 | $129,828 | $163,453 |
| 2016 | $3,815 | $287,532 | $127,283 | $160,249 |
| 2015 | $3,754 | $283,214 | $125,372 | $157,842 |
| 2014 | $3,673 | $277,668 | $122,917 | $154,751 |
Source: Public Records
Map
Nearby Homes
- 3485 Hillsborough Dr
- 2579 Montgomery Ave
- 3013 Justin Way
- 2219 Acacia Dr
- 3355 Bennett Way
- 3715 Northwood Dr Unit G
- 3825 Northwood Dr Unit A
- 2279 Saint George Dr
- 3185 Claudia Dr
- 3179 Meadowbrook Dr
- 2394 Saint George Dr
- 2917 Knoll Dr
- 2122 Dalis Dr Unit 236
- 2097 Dalis Dr Unit 79
- 2816 Glenside Dr
- 2653 Garden Ave
- 2069 Olivera Rd Unit E
- 2339 Dalis Dr Unit 193
- 2067 Olivera Rd Unit B
- 2105 Holbrook Dr
- 3490 Tanager Cir
- 3502 Tanager Cir
- 2460 Tanager Ct
- 2466 Tanager Ct
- 3484 Tanager Cir
- 3508 Tanager Cir
- 2454 Tanager Ct
- 3495 Tanager Cir
- 3489 Tanager Cir
- 3501 Tanager Cir
- 2448 Tanager Ct
- 3514 Tanager Cir
- 2472 Tanager Ct
- 3478 Tanager Cir
- 3483 Tanager Cir
- 3507 Tanager Cir
- 2442 Tanager Ct
- 3477 Tanager Cir
- 3513 Tanager Cir
- 3520 Tanager Cir
Your Personal Tour Guide
Ask me questions while you tour the home.