
Seller's Agent in 2016
Matt Hurlburt
RE/MAX
(800) 639-4520
1 in this area
145 Total Sales
Estimated Value: $360,000 - $395,948
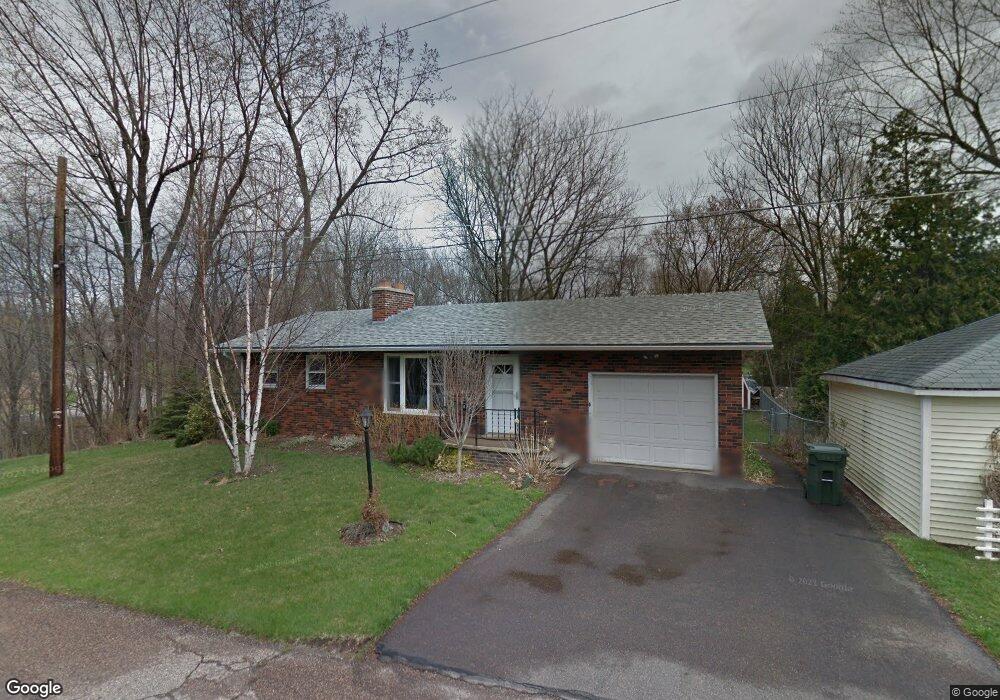
This brick ranch is tucked away on the edge of the City, and is a treasured secret. At the end of a dead-end street, it boasts a large fully fenced back yard, and a quiet sense of space not common in an urban setting. Pride of ownership is evident the moment you approach the sidewalk, and continues throughout the pleasantly updated home. Recent improvements include an architectural shingle roof, egress windows in each bedroom, garage door, dark laminate flooring, dining room light fixture, stainless slide-in range, rear deck, fresh paint, and sewer line to street. Living space is significantly expanded for three seasons, via the large screened porch off the dining room. Beyond, the oversized deck overlooks the coveted back yard, complete with large shed. The kitchen is updated with a fresh counter top, and the bath is updated including tub and surround, vanity, toilet, etc. There isnât much to do but move in and enjoy!
| Date | Buyer | Sale Price | Title Company |
|---|---|---|---|
| Cutler Shane C | $195,000 | -- |
| Date | Event | Price | List to Sale | Price per Sq Ft | Prior Sale |
|---|---|---|---|---|---|
| 08/05/2016 08/05/16 | Sold | $235,000 | +2.2% | $258 / Sq Ft | View Prior Sale |
| 06/09/2016 06/09/16 | Pending | -- | -- | -- | |
| 06/07/2016 06/07/16 | For Sale | $229,900 | -- | $252 / Sq Ft |
| Year | Tax Paid | Tax Assessment Tax Assessment Total Assessment is a certain percentage of the fair market value that is determined by local assessors to be the total taxable value of land and additions on the property. | Land | Improvement |
|---|---|---|---|---|
| 2024 | -- | $378,900 | $173,000 | $205,900 |
| 2023 | -- | $207,100 | $86,500 | $120,600 |
| 2022 | $6,546 | $207,100 | $86,500 | $120,600 |
| 2021 | $6,353 | $207,100 | $86,500 | $120,600 |
| 2020 | $5,944 | $207,100 | $86,500 | $120,600 |
| 2019 | $5,697 | $207,100 | $86,500 | $120,600 |
| 2018 | $5,277 | $207,100 | $86,500 | $120,600 |
| 2017 | $5,256 | $207,100 | $86,500 | $120,600 |
| 2016 | $5,535 | $207,100 | $86,500 | $120,600 |
Seller's Agent in 2016
Matt Hurlburt
RE/MAX
(800) 639-4520
1 in this area
145 Total Sales
K
Buyer's Agent in 2016
Kyle Adams
KW Vermont
(802) 999-3710
3 in this area
9 Total Sales