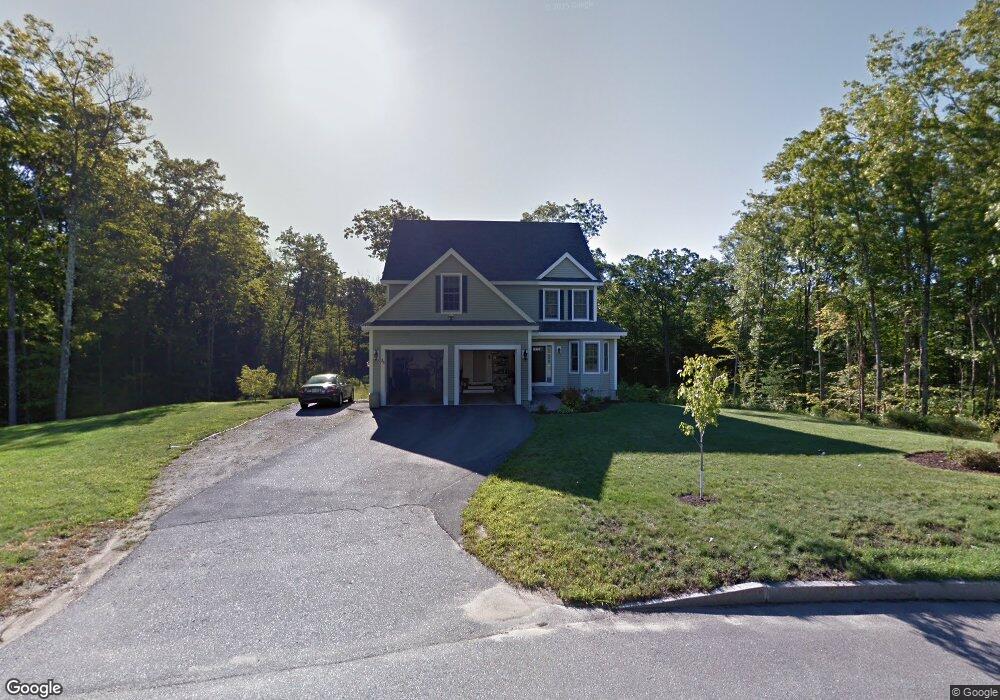
35 Samuel Dr Concord, NH 03301
North End NeighborhoodEstimated Value: $753,733 - $888,000
4
Beds
3
Baths
2,663
Sq Ft
$308/Sq Ft
Est. Value
About This Home
This home is located at 35 Samuel Dr, Concord, NH 03301 and is currently estimated at $821,183, approximately $308 per square foot. 35 Samuel Dr is a home with nearby schools including Christa McAuliffe School, Rundlett Middle School, and Concord High School.
Ownership History
Date
Name
Owned For
Owner Type
Purchase Details
Closed on
Jul 21, 2017
Sold by
Kaitz Debborah J and Kaitz Steven
Bought by
Kaitz Ft
Current Estimated Value
Purchase Details
Closed on
May 27, 2008
Sold by
Samuel Drive Llc
Bought by
Kaitz Steven H and Kaitz Debborah J
Create a Home Valuation Report for This Property
The Home Valuation Report is an in-depth analysis detailing your home's value as well as a comparison with similar homes in the area
Home Values in the Area
Average Home Value in this Area
Purchase History
| Date | Buyer | Sale Price | Title Company |
|---|---|---|---|
| Kaitz Ft | -- | -- | |
| Kaitz Steven H | $120,000 | -- |
Source: Public Records
Mortgage History
| Date | Status | Borrower | Loan Amount |
|---|---|---|---|
| Previous Owner | Kaitz Steven H | $320,000 | |
| Previous Owner | Kaitz Steven H | $56,155 | |
| Previous Owner | Kaitz Steven H | $330,000 | |
| Previous Owner | Kaitz Steven H | $58,000 |
Source: Public Records
Tax History
| Year | Tax Paid | Tax Assessment Tax Assessment Total Assessment is a certain percentage of the fair market value that is determined by local assessors to be the total taxable value of land and additions on the property. | Land | Improvement |
|---|---|---|---|---|
| 2025 | $14,319 | $491,900 | $135,600 | $356,300 |
| 2024 | $13,388 | $483,500 | $135,600 | $347,900 |
| 2023 | $12,989 | $483,600 | $135,600 | $348,000 |
| 2022 | $12,520 | $483,600 | $135,600 | $348,000 |
| 2021 | $12,148 | $483,600 | $135,600 | $348,000 |
| 2020 | $11,876 | $443,800 | $112,900 | $330,900 |
| 2019 | $11,995 | $431,800 | $120,800 | $311,000 |
| 2018 | $11,885 | $421,600 | $121,200 | $300,400 |
| 2017 | $11,722 | $415,100 | $121,200 | $293,900 |
| 2016 | $11,242 | $406,300 | $121,200 | $285,100 |
| 2015 | $11,084 | $405,400 | $105,500 | $299,900 |
| 2014 | $10,869 | $405,400 | $105,500 | $299,900 |
| 2013 | $10,293 | $402,400 | $105,500 | $296,900 |
| 2012 | $9,865 | $404,800 | $110,700 | $294,100 |
Source: Public Records
Map
Nearby Homes
- 30 Penacook St
- 13-15 Walker St
- 196 N State St
- 25 N Spring St
- 441, 443 N State St
- 7-9 Myrtle St
- 47 South St
- 58 S State St
- 47 Noyes St
- 19 Grappone Dr
- 111 -113 South Main St
- 362 N State St
- 28 Stevens Dr
- 34 Callaway Dr Unit 4
- 35 Callaway Dr Unit 6
- 0 South St Unit 4969509
- 273-279 S Main St
- 17 Callaway Dr Unit 1
- 17 Callaway Dr Unit 5
- 335 S Main St
Your Personal Tour Guide
Ask me questions while you tour the home.