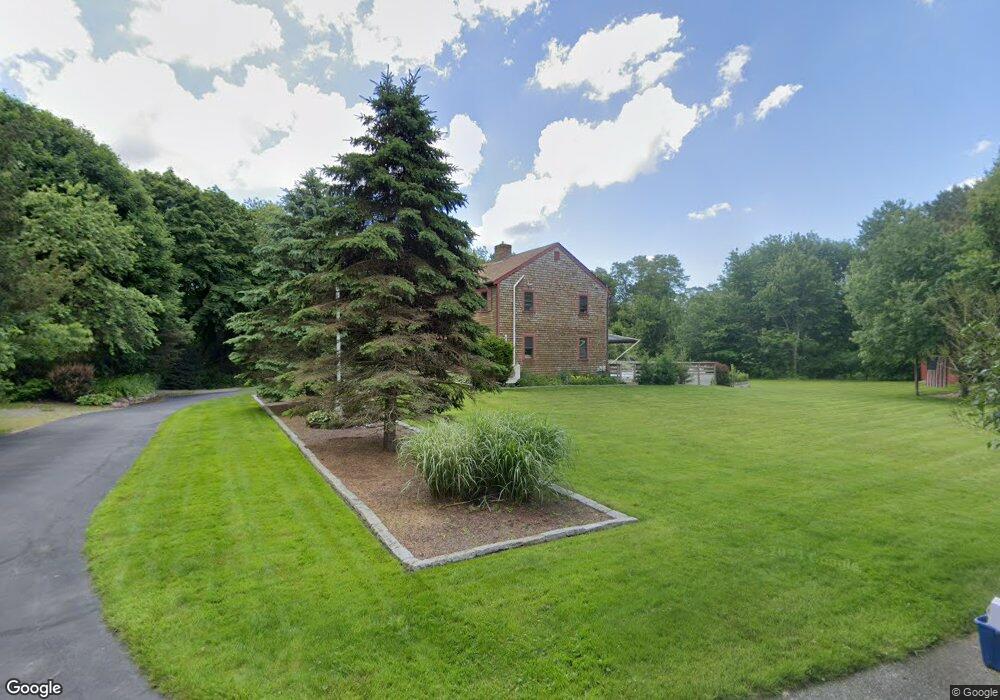
35 Soft Shell Ln Barnstable, MA 02668
West Barnstable NeighborhoodEstimated Value: $827,000 - $900,000
3
Beds
3
Baths
1,904
Sq Ft
$454/Sq Ft
Est. Value
About This Home
This home is located at 35 Soft Shell Ln, Barnstable, MA 02668 and is currently estimated at $863,534, approximately $453 per square foot. 35 Soft Shell Ln is a home located in Barnstable County with nearby schools including West Barnstable Elementary School, Barnstable United Elementary School, and Barnstable Intermediate School.
Ownership History
Date
Name
Owned For
Owner Type
Purchase Details
Closed on
Jan 22, 2024
Sold by
Mahoney Mairgreg A and Mahoney Daniel C
Bought by
Soft Shell Lane Rt and Mahoney
Current Estimated Value
Purchase Details
Closed on
Dec 15, 2008
Sold by
Challies James V and Challies Pamela J
Bought by
Challies James V
Create a Home Valuation Report for This Property
The Home Valuation Report is an in-depth analysis detailing your home's value as well as a comparison with similar homes in the area
Home Values in the Area
Average Home Value in this Area
Purchase History
| Date | Buyer | Sale Price | Title Company |
|---|---|---|---|
| Soft Shell Lane Rt | -- | None Available | |
| Challies James V | -- | -- |
Source: Public Records
Tax History
| Year | Tax Paid | Tax Assessment Tax Assessment Total Assessment is a certain percentage of the fair market value that is determined by local assessors to be the total taxable value of land and additions on the property. | Land | Improvement |
|---|---|---|---|---|
| 2025 | $7,944 | $850,500 | $301,000 | $549,500 |
| 2024 | $7,030 | $819,400 | $301,000 | $518,400 |
| 2023 | $6,855 | $752,500 | $297,900 | $454,600 |
| 2022 | $6,362 | $572,600 | $191,100 | $381,500 |
| 2021 | $6,535 | $557,600 | $203,100 | $354,500 |
| 2020 | $6,340 | $523,100 | $229,000 | $294,100 |
| 2019 | $6,641 | $540,800 | $241,600 | $299,200 |
| 2018 | $4,453 | $506,400 | $241,000 | $265,400 |
| 2017 | $6,213 | $507,600 | $247,700 | $259,900 |
| 2016 | $6,159 | $513,700 | $253,800 | $259,900 |
| 2015 | $5,941 | $496,700 | $237,900 | $258,800 |
Source: Public Records
Map
Nearby Homes
- 26 Carlson Ln
- 510 Cedar St
- 282 Parker Rd
- 74 Saddler Ln
- 29 Appaloosa Way
- 6 Harpers Hollow
- 3 Mulberry Cir
- 324 Patriot Way
- 80 Branch Terrace
- 34 Black Duck Ln
- 46 Service Rd
- 817 Race Ln
- 817 Race Ln
- 1028 Old Falmouth Rd
- 7 Maxwell Ln
- 159 Great Hill Rd
- 87 Foxglove Rd
- 900 Old Stage Rd
- 11 Shepherds Way
- 4 Wing Blvd
- 35 Softshell Ln
- 897 Main St
- 857 Main St
- 905 Main St
- 881 Main St
- 881 Route 6a
- 837 Main St
- 96 Lombard Ave
- 66 Willow St
- 825 Main St
- 881 Main (Route 6a) St
- 881 Main Rte 6a St
- 96 Lombard Ave
- 842 Main St
- 2465 Meetinghouse Way
- 50 Willow St
- 866 Main Street Rt 6a
- 10 Salt Meadow Ln
- 2465 Meetinghouse Route 149 Way
- 30 Gramma's
Your Personal Tour Guide
Ask me questions while you tour the home.