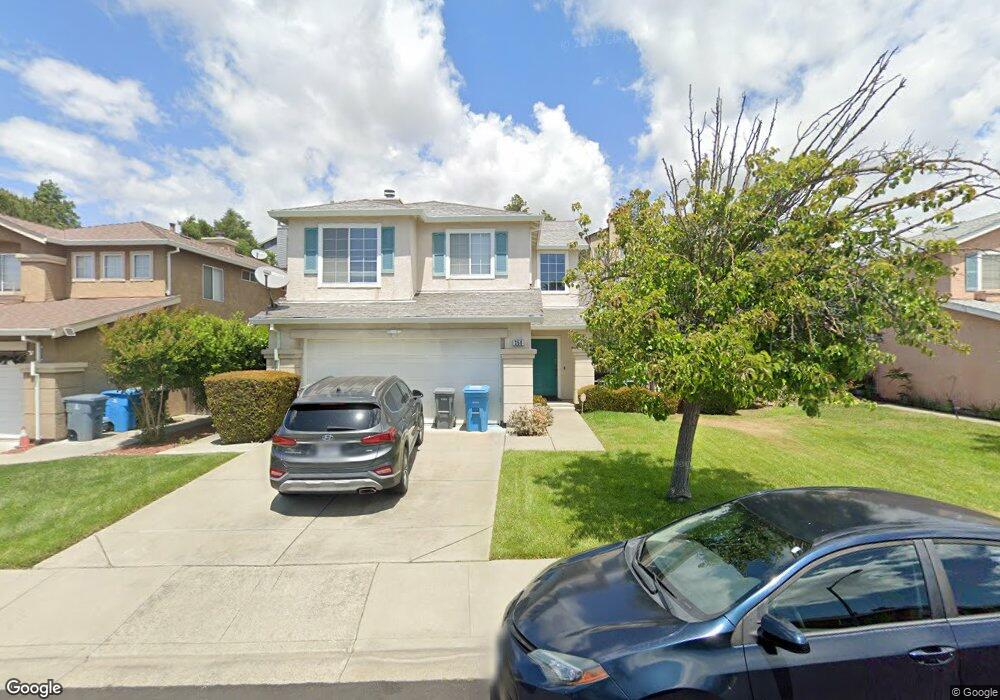
350 Carousel Dr Vallejo, CA 94589
North Vallejo NeighborhoodEstimated Value: $529,000 - $571,000
4
Beds
3
Baths
1,693
Sq Ft
$327/Sq Ft
Est. Value
About This Home
This home is located at 350 Carousel Dr, Vallejo, CA 94589 and is currently estimated at $553,119, approximately $326 per square foot. 350 Carousel Dr is a home located in Solano County with nearby schools including Elsa Widenmann Elementary, Solano Middle School, and Vallejo High School.
Ownership History
Date
Name
Owned For
Owner Type
Purchase Details
Closed on
Oct 2, 2003
Sold by
Hay Carol A and Johnson Carol A
Bought by
Hay William F and Hay Carol A
Current Estimated Value
Home Financials for this Owner
Home Financials are based on the most recent Mortgage that was taken out on this home.
Original Mortgage
$200,000
Outstanding Balance
$90,715
Interest Rate
6.27%
Mortgage Type
Purchase Money Mortgage
Estimated Equity
$462,404
Purchase Details
Closed on
Mar 1, 1999
Sold by
Va
Bought by
Johnson Carol A
Home Financials for this Owner
Home Financials are based on the most recent Mortgage that was taken out on this home.
Original Mortgage
$155,675
Interest Rate
6.76%
Mortgage Type
FHA
Purchase Details
Closed on
Nov 5, 1997
Sold by
Norwest Mtg Inc
Bought by
Va
Purchase Details
Closed on
Nov 4, 1997
Sold by
Robinson John
Bought by
Norwest Mtg Inc
Purchase Details
Closed on
May 17, 1995
Sold by
Kaufman & Broad Of Northern California
Bought by
Robinson John
Home Financials for this Owner
Home Financials are based on the most recent Mortgage that was taken out on this home.
Original Mortgage
$163,279
Interest Rate
8.43%
Mortgage Type
Assumption
Create a Home Valuation Report for This Property
The Home Valuation Report is an in-depth analysis detailing your home's value as well as a comparison with similar homes in the area
Home Values in the Area
Average Home Value in this Area
Purchase History
| Date | Buyer | Sale Price | Title Company |
|---|---|---|---|
| Hay William F | -- | Fidelity Title Co | |
| Johnson Carol A | $157,000 | Frontier Title Company | |
| Va | -- | North American Title Co | |
| Norwest Mtg Inc | $172,096 | North American Title Co | |
| Robinson John | $160,500 | First American Title Guarant | |
| Robinson John | -- | First American Title Guarant |
Source: Public Records
Mortgage History
| Date | Status | Borrower | Loan Amount |
|---|---|---|---|
| Open | Hay William F | $200,000 | |
| Closed | Johnson Carol A | $155,675 | |
| Previous Owner | Robinson John | $163,279 |
Source: Public Records
Tax History
| Year | Tax Paid | Tax Assessment Tax Assessment Total Assessment is a certain percentage of the fair market value that is determined by local assessors to be the total taxable value of land and additions on the property. | Land | Improvement |
|---|---|---|---|---|
| 2025 | $4,823 | $274,337 | $70,537 | $203,800 |
| 2024 | $4,823 | $268,958 | $69,154 | $199,804 |
| 2023 | $5,181 | $263,686 | $67,799 | $195,887 |
| 2022 | $5,042 | $258,517 | $66,471 | $192,046 |
| 2021 | $4,722 | $253,449 | $65,168 | $188,281 |
| 2020 | $4,461 | $250,851 | $64,500 | $186,351 |
| 2019 | $4,715 | $245,934 | $63,236 | $182,698 |
| 2018 | $5,202 | $241,113 | $61,997 | $179,116 |
| 2017 | $5,212 | $236,386 | $60,782 | $175,604 |
| 2016 | $4,646 | $231,752 | $59,591 | $172,161 |
| 2015 | $4,494 | $228,271 | $58,696 | $169,575 |
| 2014 | $4,519 | $223,801 | $57,547 | $166,254 |
Source: Public Records
Map
Nearby Homes
- 143 Carnival Ct
- 157 Haviture Way
- 243 Sage St
- 464 Evelyn Cir
- 0 Fairgrounds Dr Unit 325101300
- 1118 Waltz Ct
- 124 Erin Dr
- 475 Whitney Ave
- 147 Erin Dr
- 9102 Cambridge Cir
- 8405 Benavente Ct
- 1146 Waltz Ct
- 240 Parkview Terrace
- 7817 Caracena Ct
- 1148 Sonata Dr Unit 96
- 408 Lakeside Dr
- 1117 Symphony Way
- 1139 Symphony Way
- 150 Granite Ct
- 355 Parkview Terrace Unit 2
- 360 Carousel Dr
- 340 Carousel Dr
- 330 Carousel Dr
- 345 Cimarron Dr
- 335 Cimarron Dr
- 355 Cimarron Dr
- 325 Cimarron Dr
- 380 Carousel Dr
- 320 Carousel Dr
- 351 Carousel Dr
- 361 Carousel Dr
- 341 Carousel Dr
- 271 Exposition Dr
- 365 Cimarron Dr
- 315 Cimarron Dr
- 331 Carousel Dr
- 390 Carousel Dr
- 310 Carousel Dr
- 375 Cimarron Dr
- 321 Carousel Dr
Your Personal Tour Guide
Ask me questions while you tour the home.