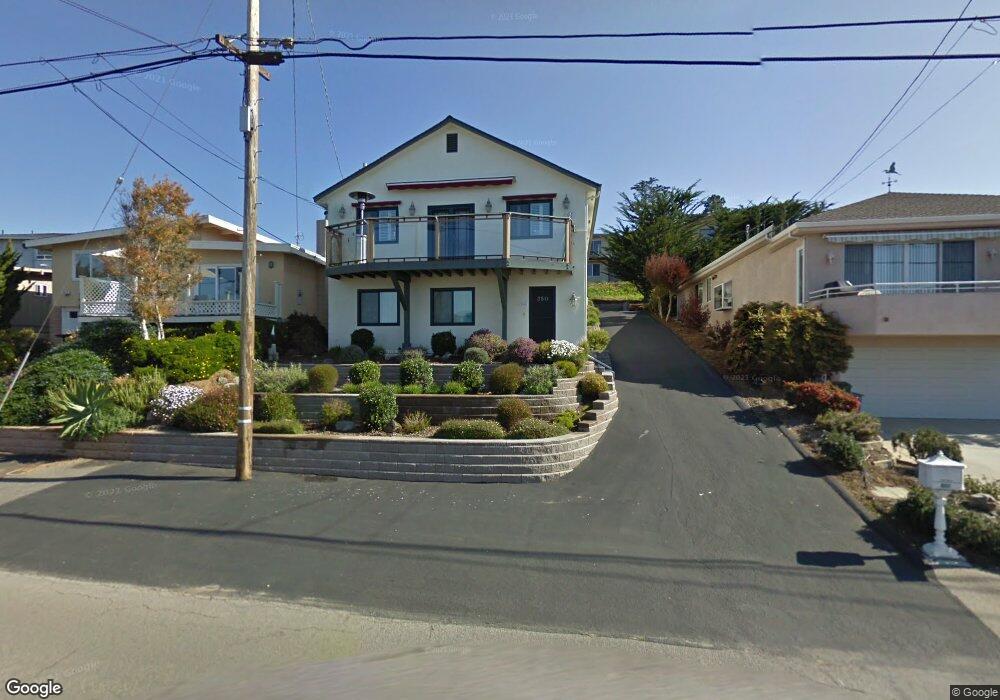
350 Piney Way Morro Bay, CA 93442
Estimated Value: $1,287,000 - $1,470,000
3
Beds
3
Baths
1,800
Sq Ft
$746/Sq Ft
Est. Value
About This Home
This home is located at 350 Piney Way, Morro Bay, CA 93442 and is currently estimated at $1,342,027, approximately $745 per square foot. 350 Piney Way is a home located in San Luis Obispo County with nearby schools including Del Mar Elementary School, Los Osos Middle School, and Morro Bay High School.
Ownership History
Date
Name
Owned For
Owner Type
Purchase Details
Closed on
Jul 28, 2010
Sold by
Stanley Barbara and Myers Ronald D
Bought by
R & B Bayview Properties Llc
Current Estimated Value
Purchase Details
Closed on
Jul 26, 2010
Sold by
Basin Partners Llc
Bought by
Stanley Barbara
Purchase Details
Closed on
Jan 23, 2008
Sold by
Davis Douglas E
Bought by
Basin Partners Llc
Purchase Details
Closed on
Aug 29, 2002
Sold by
Davis Douglas E and Schultz Susan C
Bought by
Davis Douglas E
Create a Home Valuation Report for This Property
The Home Valuation Report is an in-depth analysis detailing your home's value as well as a comparison with similar homes in the area
Home Values in the Area
Average Home Value in this Area
Purchase History
| Date | Buyer | Sale Price | Title Company |
|---|---|---|---|
| R & B Bayview Properties Llc | -- | None Available | |
| Myers Ronald D | -- | None Available | |
| Stanley Barbara | -- | None Available | |
| Basin Partners Llc | $780,000 | First American Title Co | |
| Davis Douglas E | -- | -- |
Source: Public Records
Tax History
| Year | Tax Paid | Tax Assessment Tax Assessment Total Assessment is a certain percentage of the fair market value that is determined by local assessors to be the total taxable value of land and additions on the property. | Land | Improvement |
|---|---|---|---|---|
| 2025 | $9,162 | $845,567 | $544,495 | $301,072 |
| 2024 | $8,996 | $828,988 | $533,819 | $295,169 |
| 2023 | $8,996 | $812,734 | $523,352 | $289,382 |
| 2022 | $8,432 | $796,799 | $513,091 | $283,708 |
| 2021 | $8,298 | $781,177 | $503,031 | $278,146 |
| 2020 | $8,213 | $773,168 | $497,874 | $275,294 |
| 2019 | $8,128 | $758,009 | $488,112 | $269,897 |
| 2018 | $7,968 | $743,147 | $478,542 | $264,605 |
| 2017 | $7,812 | $728,576 | $469,159 | $259,417 |
| 2016 | $7,659 | $714,291 | $459,960 | $254,331 |
| 2015 | $7,542 | $703,562 | $453,051 | $250,511 |
| 2014 | $6,657 | $663,000 | $425,000 | $238,000 |
Source: Public Records
Map
Nearby Homes
- 190 Main St Unit 25
- 173 Sandpiper Ln
- 163 Sandpiper Ln
- 436 Morro Ave
- 485 Morro Ave
- 444 Kings Ave
- 245 Driftwood St
- 941 Marina St
- 600 Morro Bay Blvd Unit B
- 260 Pacific St
- 731 Butte Ave
- 240 Pacific St
- 960 Las Tunas St
- 1111 Main St
- 1151 Main St
- 1187 Main St
- 1260 Main St
- 369 Dunbar St
- 545 Quinn Ct
- 1537 White Pine Dr Unit 48
- 360 Piney Way
- 340 Piney Way
- 330 Piney Way
- 375 Bernardo Ave
- 387 Bernardo Ave
- 385 Bernardo Ave
- 370 Piney Way
- 766 Ridgeway St
- 371 Bernardo Ave
- 710 Ridgeway St
- 390 Piney Way
- 320 Piney Way
- 333 Piney Way
- 365 Bernardo Ave
- 310 Piney Way
- 350 Piney Ln
- 345 Bernardo Ave
- 341 Piney Ln
- 351 Piney Way
- 337 Bernardo Ave
Your Personal Tour Guide
Ask me questions while you tour the home.