Estimated Value: $393,000 - $505,000
About This Home
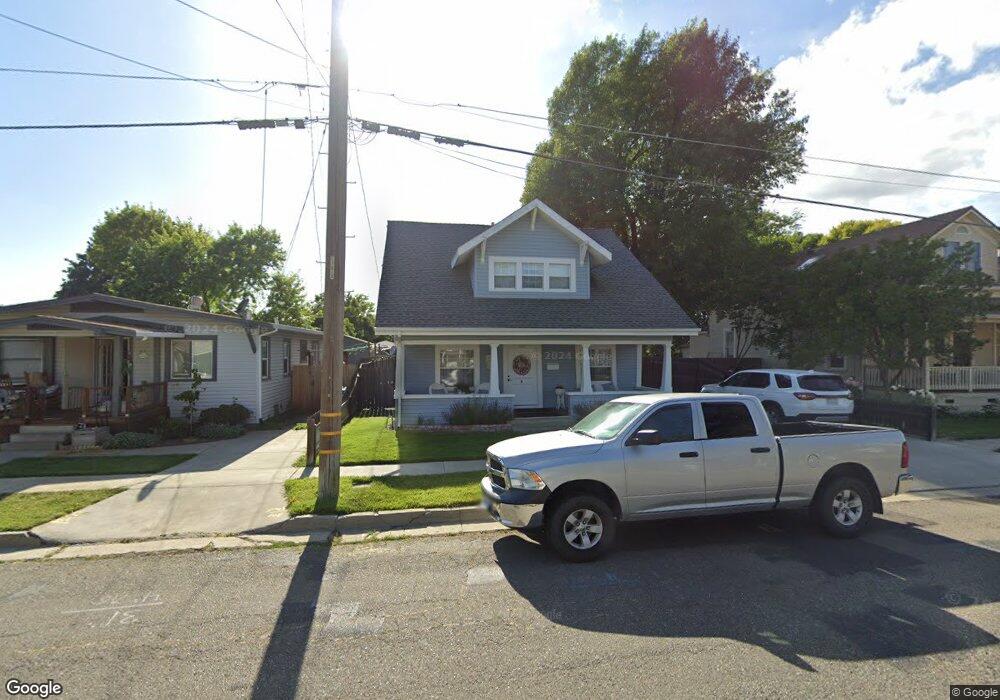
This home is located at 350 S 3rd St, Dixon, CA 95620 and is currently estimated at $435,870, approximately $432 per square foot. 350 S 3rd St is a home located in Solano County with nearby schools including Anderson (Linford L.) Elementary School, Dixon High School, and Dixon Montessori Charter.
Ownership History
We collect this data history from publicly available records. To have your information removed, we recommend requesting removal directly through your county’s website.
Purchase Details
Purchase Details
Home Financials for this Owner
Home Financials are based on the most recent Mortgage that was taken out on this home.Purchase Details
Purchase Details
Home Financials for this Owner
Home Financials are based on the most recent Mortgage that was taken out on this home.Home Values in the Area
Average Home Value in this Area
Purchase History
We collect this data history from publicly available records. To have your information removed, we recommend requesting removal directly through your county’s website.
| Date | Buyer | Sale Price | Title Company |
|---|---|---|---|
| -- | None Available | ||
| -- | First American Title Co | ||
| -- | -- | ||
| -- | North American Title Co Inc |
Mortgage History
We collect this data history from publicly available records. To have your information removed, we recommend requesting removal directly through your county’s website.
| Date | Status | Borrower | Loan Amount |
|---|---|---|---|
| Open | $154,000 | ||
| Closed | $75,000 |
Tax History
We collect this data history from publicly available records. To have your information removed, we recommend requesting removal directly through your county’s website.
| Year | Tax Paid | Tax Assessment Tax Assessment Total Assessment is a certain percentage of the fair market value that is determined by local assessors to be the total taxable value of land and additions on the property. | Land | Improvement |
|---|---|---|---|---|
| 2025 | $2,026 | $189,267 | $108,218 | $81,049 |
| 2024 | $2,026 | $185,557 | $106,097 | $79,460 |
| 2023 | $1,964 | $181,919 | $104,017 | $77,902 |
| 2022 | $1,935 | $178,353 | $101,978 | $76,375 |
| 2021 | $1,910 | $174,857 | $99,979 | $74,878 |
| 2020 | $1,878 | $173,065 | $98,954 | $74,111 |
| 2019 | $1,842 | $169,672 | $97,014 | $72,658 |
| 2018 | $1,833 | $166,346 | $95,112 | $71,234 |
| 2017 | $1,786 | $163,086 | $93,248 | $69,838 |
| 2016 | $1,700 | $159,889 | $91,420 | $68,469 |
| 2015 | $1,660 | $157,488 | $90,047 | $67,441 |
| 2014 | $1,641 | $154,404 | $88,284 | $66,120 |
Map
- 390 S 3rd St
- 241 S 1st St
- 770 Collier Dr
- 120 Victoria Ct
- 630 Marvin Way
- 1125 Arizona Ct
- 580 W B St
- 1130 Legion Ct
- 1065 Swarthmore Ct
- 1085 Purdue Ct
- 600 W C St
- 550 W Creekside Cir
- 450 Syracuse Ln
- 1065 Wesleyan Ct
- 655 W Creekside Cir
- 640 E Creekside Cir
- 1116 Valley Glen Dr
- 10 Solano Dr
- 625 Cypress St
- 210 Heritage Ln
Ask me questions while you tour the home.