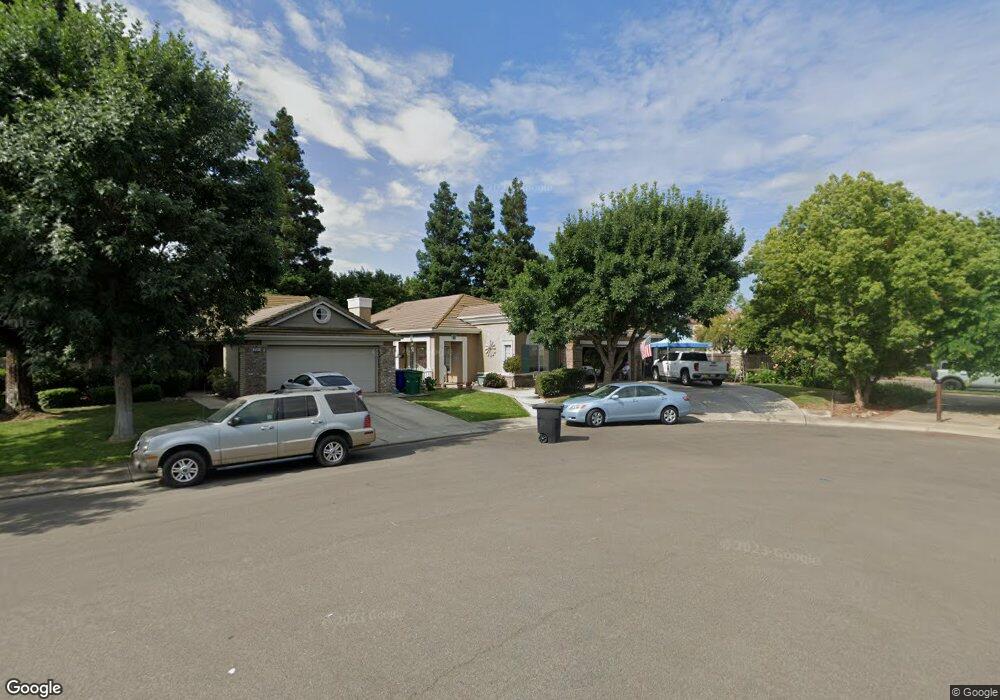
3500 Kentfield Ct Modesto, CA 95355
Village One NeighborhoodEstimated Value: $424,000 - $553,000
4
Beds
2
Baths
1,810
Sq Ft
$278/Sq Ft
Est. Value
About This Home
This home is located at 3500 Kentfield Ct, Modesto, CA 95355 and is currently estimated at $503,699, approximately $278 per square foot. 3500 Kentfield Ct is a home located in Stanislaus County with nearby schools including Mary Ann Sanders Elementary School, Daniel J. Savage Middle School, and James C. Enochs High School.
Ownership History
Date
Name
Owned For
Owner Type
Purchase Details
Closed on
Sep 9, 2019
Sold by
Fernandez John K and Fernandez Margherita L
Bought by
Fernandez John Kevin and Fernandez Margherita Leona
Current Estimated Value
Purchase Details
Closed on
Aug 23, 2010
Sold by
Fernandez John K and Fernandez Margaret L
Bought by
Fernandez John K and Fernandez Margaret L
Home Financials for this Owner
Home Financials are based on the most recent Mortgage that was taken out on this home.
Original Mortgage
$184,000
Interest Rate
4.52%
Mortgage Type
New Conventional
Purchase Details
Closed on
Aug 19, 1997
Sold by
Inland Village
Bought by
Fernandez John K and Willey Margaret L
Home Financials for this Owner
Home Financials are based on the most recent Mortgage that was taken out on this home.
Original Mortgage
$146,350
Interest Rate
7.13%
Create a Home Valuation Report for This Property
The Home Valuation Report is an in-depth analysis detailing your home's value as well as a comparison with similar homes in the area
Home Values in the Area
Average Home Value in this Area
Purchase History
| Date | Buyer | Sale Price | Title Company |
|---|---|---|---|
| Fernandez John Kevin | -- | None Available | |
| Fernandez John K | -- | Stewart Title Of California | |
| Fernandez John K | $154,500 | Fidelity National Title |
Source: Public Records
Mortgage History
| Date | Status | Borrower | Loan Amount |
|---|---|---|---|
| Closed | Fernandez John K | $184,000 | |
| Previous Owner | Fernandez John K | $146,350 |
Source: Public Records
Tax History
| Year | Tax Paid | Tax Assessment Tax Assessment Total Assessment is a certain percentage of the fair market value that is determined by local assessors to be the total taxable value of land and additions on the property. | Land | Improvement |
|---|---|---|---|---|
| 2025 | $3,059 | $245,879 | $63,858 | $182,021 |
| 2024 | $2,979 | $241,058 | $62,606 | $178,452 |
| 2023 | $2,928 | $236,332 | $61,379 | $174,953 |
| 2022 | $2,808 | $231,699 | $60,176 | $171,523 |
| 2021 | $2,717 | $227,157 | $58,997 | $168,160 |
| 2020 | $2,651 | $224,829 | $58,393 | $166,436 |
| 2019 | $2,778 | $220,422 | $57,249 | $163,173 |
| 2018 | $2,638 | $216,101 | $56,127 | $159,974 |
| 2017 | $2,583 | $211,865 | $55,027 | $156,838 |
| 2016 | $2,531 | $207,712 | $53,949 | $153,763 |
| 2015 | $2,500 | $204,593 | $53,139 | $151,454 |
| 2014 | $2,477 | $200,587 | $52,099 | $148,488 |
Source: Public Records
Map
Nearby Homes
- 3517 Kentfield Ct
- 3604 Hillglen Ave
- 3417 Lauding Way
- 3308 Creek Bed Ct
- 3336 Sleepy Hollow Ln
- 3005 Litt Rd
- 2909 Kingman Ct
- 3329 Vancouver Dr
- 3116 Dovehouse Ln
- 2833 Winged Foot Way
- 2993 Essie Place
- 2805 Medinah Way
- 3941 Roselle Ave
- 3900 Sanderling Ave
- 2708 Winged Foot Way
- 3812 Lookout Dr
- 3509 Sharon Ave
- 2621 Redtail Hawk Rd
- 2613 Medinah Ct
- 2604 Redtail Hawk Rd
- 3504 Kentfield Ct
- 3508 Kentfield Ct
- 3501 Pinenut Ct
- 3505 Pinenut Ct
- 3420 Yerington Ct
- 3509 Pinenut Ct
- 3501 Kentfield Ct
- 3512 Kentfield Ct
- 3505 Kentfield Ct
- 3421 Inverness Ct
- 3513 Pinenut Ct
- 3509 Kentfield Ct
- 3516 Kentfield Ct
- 3421 Yerington Ct
- 3416 Yerington Ct
- 3513 Kentfield Ct
- 3517 Pinenut Ct
- 3417 Inverness Ct
- 3520 Kentfield Ct
- 3500 Pinenut Ct
Your Personal Tour Guide
Ask me questions while you tour the home.