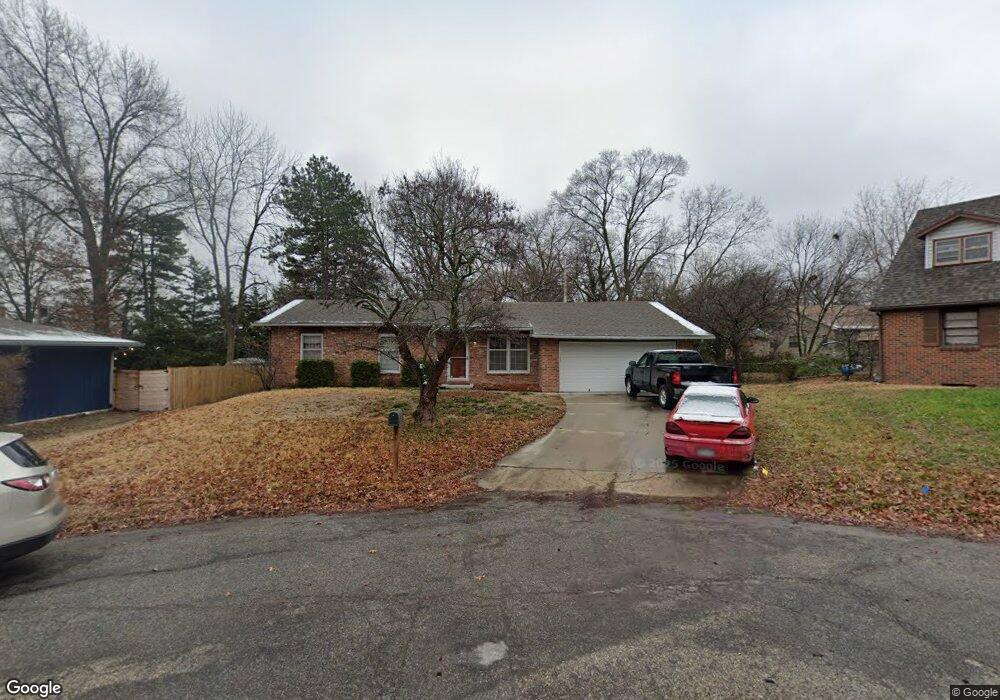
3511 W 9th Ct Lawrence, KS 66049
Perry Park NeighborhoodEstimated Value: $297,000 - $312,000
3
Beds
2
Baths
1,694
Sq Ft
$181/Sq Ft
Est. Value
About This Home
This home is located at 3511 W 9th Ct, Lawrence, KS 66049 and is currently estimated at $307,254, approximately $181 per square foot. 3511 W 9th Ct is a home located in Douglas County with nearby schools including Sunset Hill Elementary School, West Middle School, and Lawrence Free State High School.
Ownership History
Date
Name
Owned For
Owner Type
Purchase Details
Closed on
Jan 4, 2011
Sold by
Hanshaw Doug
Bought by
Murphy Renee and Hanshaw Renee
Current Estimated Value
Purchase Details
Closed on
Mar 27, 2008
Sold by
Harrison Joan and Keenan William W
Bought by
Murphy Renee A
Home Financials for this Owner
Home Financials are based on the most recent Mortgage that was taken out on this home.
Original Mortgage
$113,050
Outstanding Balance
$72,430
Interest Rate
6.19%
Mortgage Type
Purchase Money Mortgage
Estimated Equity
$234,824
Purchase Details
Closed on
Aug 19, 2003
Sold by
Keenan William W and Keenan William Weir
Bought by
Keenan William W
Home Financials for this Owner
Home Financials are based on the most recent Mortgage that was taken out on this home.
Original Mortgage
$110,500
Interest Rate
9.95%
Mortgage Type
Purchase Money Mortgage
Create a Home Valuation Report for This Property
The Home Valuation Report is an in-depth analysis detailing your home's value as well as a comparison with similar homes in the area
Home Values in the Area
Average Home Value in this Area
Purchase History
| Date | Buyer | Sale Price | Title Company |
|---|---|---|---|
| Murphy Renee | -- | None Available | |
| Murphy Renee A | $119,000 | First American Title | |
| Keenan William W | -- | Northwest Title & Escrow |
Source: Public Records
Mortgage History
| Date | Status | Borrower | Loan Amount |
|---|---|---|---|
| Open | Murphy Renee A | $113,050 | |
| Previous Owner | Keenan William W | $110,500 |
Source: Public Records
Tax History Compared to Growth
Tax History
| Year | Tax Paid | Tax Assessment Tax Assessment Total Assessment is a certain percentage of the fair market value that is determined by local assessors to be the total taxable value of land and additions on the property. | Land | Improvement |
|---|---|---|---|---|
| 2025 | $3,562 | $31,240 | $7,475 | $23,765 |
| 2024 | $3,562 | $29,107 | $5,750 | $23,357 |
| 2023 | $3,605 | $28,230 | $5,520 | $22,710 |
| 2022 | $3,014 | $23,529 | $4,830 | $18,699 |
| 2021 | $2,899 | $21,804 | $3,795 | $18,009 |
| 2020 | $2,723 | $20,608 | $3,795 | $16,813 |
| 2019 | $2,688 | $20,367 | $3,795 | $16,572 |
| 2018 | $2,565 | $19,309 | $3,680 | $15,629 |
| 2017 | $2,533 | $18,860 | $3,680 | $15,180 |
| 2016 | $2,364 | $18,400 | $3,680 | $14,720 |
| 2015 | $1,867 | $14,605 | $3,680 | $10,925 |
| 2014 | $1,819 | $14,375 | $3,680 | $10,695 |
Source: Public Records
Map
Nearby Homes
- 3607 Crestview Rd
- 3600 Parkview Ct
- 3721 Pinnacle Ct
- 922 Alma Ct
- 3900 Willshire Dr
- 3723 Pinnacle Ct
- 1012 Alma Dr
- 1001 Alma Dr
- 3404 Oxford Ct
- 1008 Lawrence Ave
- 3916 Monterey Ct
- 1014 Lawrence Ave
- 503 Abilene St
- 3408 W 13th St
- 713 Sturbridge Ct
- 3016 W 7th St
- 3025 Wellington Ct
- 328 Cattleman Trail
- 611 Eldridge St
- 4201 Crofton Ct