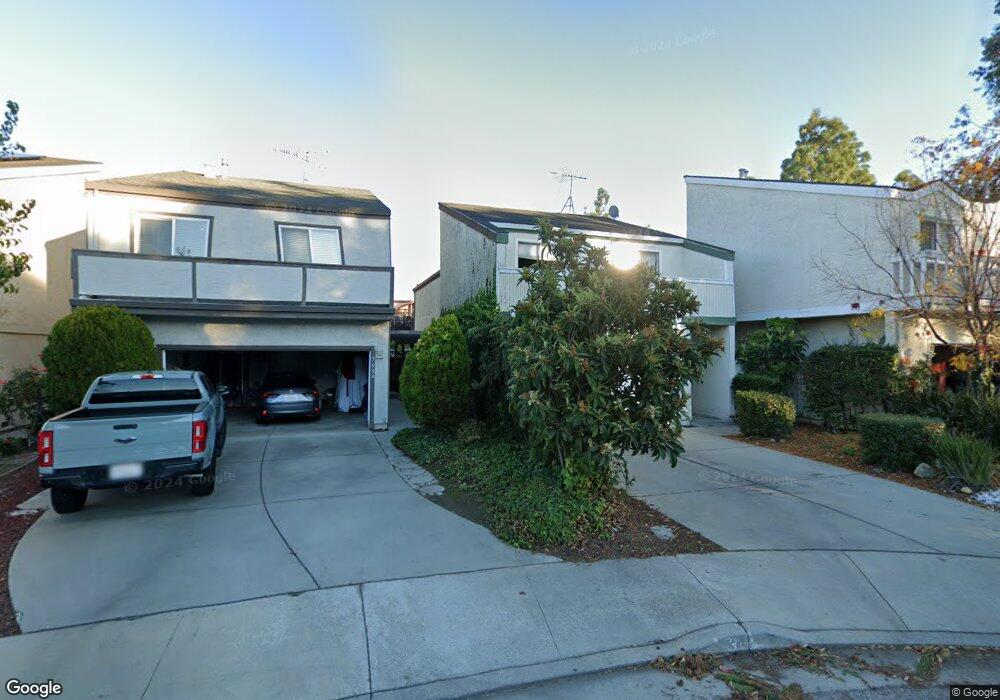
3542 Mount Davidson Ct San Jose, CA 95124
Cambrian NeighborhoodEstimated Value: $1,543,389 - $1,774,000
3
Beds
3
Baths
1,827
Sq Ft
$892/Sq Ft
Est. Value
About This Home
This home is located at 3542 Mount Davidson Ct, San Jose, CA 95124 and is currently estimated at $1,630,097, approximately $892 per square foot. 3542 Mount Davidson Ct is a home located in Santa Clara County with nearby schools including Leigh High School, Branham High School, and Farnham Elementary School.
Ownership History
Date
Name
Owned For
Owner Type
Purchase Details
Closed on
Feb 7, 2007
Sold by
Mapar David H and Mapar Haydeh M
Bought by
Mapar David H and Mapar Haydeh M
Current Estimated Value
Purchase Details
Closed on
Mar 2, 1999
Sold by
Mapar David Hamid
Bought by
Mapar David Hamid and Mapar Haydeh M
Home Financials for this Owner
Home Financials are based on the most recent Mortgage that was taken out on this home.
Original Mortgage
$167,000
Interest Rate
6.73%
Purchase Details
Closed on
Feb 1, 1999
Sold by
Vahid Mansubi and Hamid David
Bought by
Mapar David Hamid
Home Financials for this Owner
Home Financials are based on the most recent Mortgage that was taken out on this home.
Original Mortgage
$167,000
Interest Rate
6.73%
Create a Home Valuation Report for This Property
The Home Valuation Report is an in-depth analysis detailing your home's value as well as a comparison with similar homes in the area
Home Values in the Area
Average Home Value in this Area
Purchase History
| Date | Buyer | Sale Price | Title Company |
|---|---|---|---|
| Mapar David H | -- | None Available | |
| Mapar David Hamid | -- | Chicago Title Co | |
| Mapar David Hamid | $83,500 | Fidelity National Title Co |
Source: Public Records
Mortgage History
| Date | Status | Borrower | Loan Amount |
|---|---|---|---|
| Closed | Mapar David Hamid | $167,000 |
Source: Public Records
Tax History
| Year | Tax Paid | Tax Assessment Tax Assessment Total Assessment is a certain percentage of the fair market value that is determined by local assessors to be the total taxable value of land and additions on the property. | Land | Improvement |
|---|---|---|---|---|
| 2025 | $6,504 | $401,111 | $196,359 | $204,752 |
| 2024 | $6,504 | $393,247 | $192,509 | $200,738 |
| 2023 | $6,418 | $385,537 | $188,735 | $196,802 |
| 2022 | $6,311 | $377,979 | $185,035 | $192,944 |
| 2021 | $6,145 | $370,568 | $181,407 | $189,161 |
| 2020 | $5,857 | $366,769 | $179,547 | $187,222 |
| 2019 | $5,763 | $359,578 | $176,027 | $183,551 |
| 2018 | $5,604 | $352,528 | $172,576 | $179,952 |
| 2017 | $5,450 | $345,617 | $169,193 | $176,424 |
| 2016 | $5,193 | $338,841 | $165,876 | $172,965 |
| 2015 | $5,125 | $333,752 | $163,385 | $170,367 |
| 2014 | $4,640 | $327,215 | $160,185 | $167,030 |
Source: Public Records
Map
Nearby Homes
- 3673 S Bascom Ave
- 3492 Wine Barrel Way
- 1526 Redding Park Ln
- 3449 Wine Cask Way
- 3685 Calvin Ave
- 135 Redding Rd Unit A
- 101 Redding Rd Unit A4
- 1054 Longfellow Ave
- 2163 Woodard Rd
- 1500 Camden Ave
- 15400 Herring Ave
- 1172 Longfellow Ave
- 404 Shamrock Dr
- 4008 Halkins Dr
- 16137 Loretta Ln
- 16152 Loretta Ln
- 4101 Ashbrook Cir
- 2289 Sun Glory Ln Unit A
- 1155 Shamrock Dr
- 219 Beethoven Ln
- 3534 Mount Davidson Ct
- 3550 Mount Davidson Ct
- 3526 Mount Davidson Ct
- 3518 Mount Davidson Ct
- 3539 Mccoppin Park Ct
- 3531 Mccoppin Park Ct
- 3508 Mount Davidson Ct
- 3523 Mccoppin Park Ct
- 3545 Mccoppin Park Ct
- 3515 Mccoppin Park Ct
- 3507 Mccoppin Park Ct
- 3517 Mount Davidson Ct
- 3525 Mount Davidson Ct
- 3533 Mount Davidson Ct
- 3509 Mount Davidson Ct
- 3549 Mount Davidson Ct
- 3541 Mount Davidson Ct
- 2381 Mount Davidson Dr
- 2375 Mount Davidson Dr
- 2387 Mount Davidson Dr
Your Personal Tour Guide
Ask me questions while you tour the home.