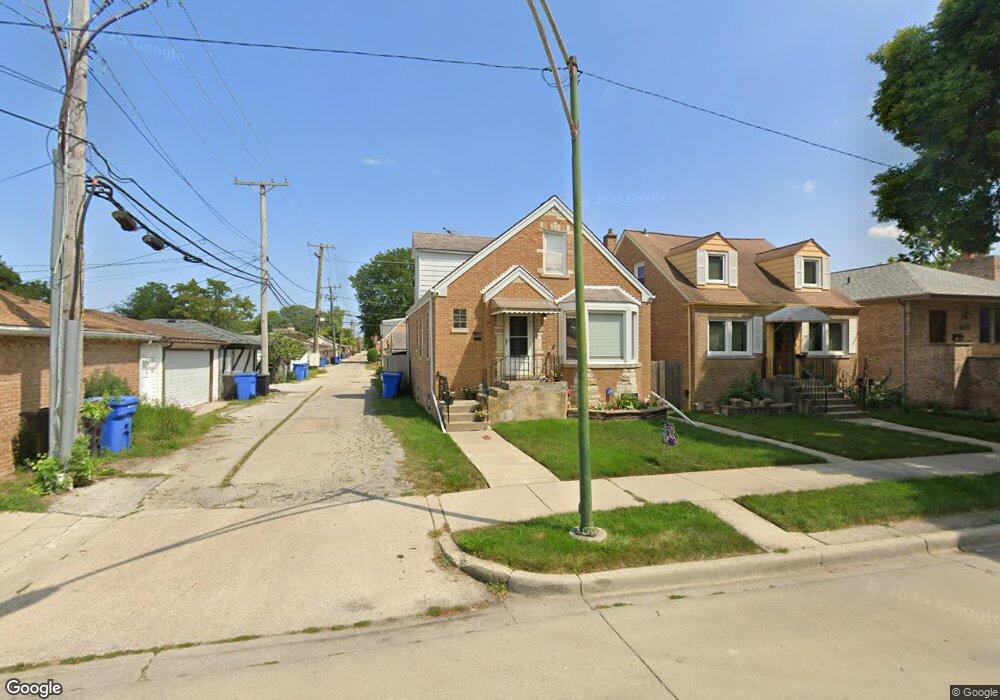
3547 N Pontiac Ave Chicago, IL 60634
Belmont Terrace NeighborhoodEstimated Value: $384,570 - $418,000
4
Beds
3
Baths
1,347
Sq Ft
$299/Sq Ft
Est. Value
About This Home
This home is located at 3547 N Pontiac Ave, Chicago, IL 60634 and is currently estimated at $402,893, approximately $299 per square foot. 3547 N Pontiac Ave is a home located in Cook County with nearby schools including Canty Elementary School, Steinmetz College Prep, and St. Francis Borgia School.
Ownership History
Date
Name
Owned For
Owner Type
Purchase Details
Closed on
Feb 17, 2016
Sold by
Oestmann Lauren M and Vida Brian M
Bought by
Vida Brian M and Vida Lauren M
Current Estimated Value
Home Financials for this Owner
Home Financials are based on the most recent Mortgage that was taken out on this home.
Original Mortgage
$197,500
Outstanding Balance
$81,731
Interest Rate
3%
Mortgage Type
New Conventional
Estimated Equity
$321,162
Purchase Details
Closed on
Mar 29, 2010
Sold by
Nemecek Marie F and Nemecek Charles J
Bought by
Oestmann Lauren M and Vida Brian M
Home Financials for this Owner
Home Financials are based on the most recent Mortgage that was taken out on this home.
Original Mortgage
$215,523
Interest Rate
4.96%
Mortgage Type
FHA
Purchase Details
Closed on
Aug 25, 1994
Sold by
Nemecek Marie F
Bought by
Nemecek Marie F and Nemecek Charles J
Create a Home Valuation Report for This Property
The Home Valuation Report is an in-depth analysis detailing your home's value as well as a comparison with similar homes in the area
Home Values in the Area
Average Home Value in this Area
Purchase History
| Date | Buyer | Sale Price | Title Company |
|---|---|---|---|
| Vida Brian M | -- | Executive Land Title | |
| Oestmann Lauren M | $219,500 | Multiple | |
| Nemecek Marie F | -- | -- |
Source: Public Records
Mortgage History
| Date | Status | Borrower | Loan Amount |
|---|---|---|---|
| Open | Vida Brian M | $197,500 | |
| Closed | Oestmann Lauren M | $215,523 |
Source: Public Records
Tax History Compared to Growth
Tax History
| Year | Tax Paid | Tax Assessment Tax Assessment Total Assessment is a certain percentage of the fair market value that is determined by local assessors to be the total taxable value of land and additions on the property. | Land | Improvement |
|---|---|---|---|---|
| 2024 | $4,250 | $32,000 | $9,000 | $23,000 |
| 2023 | $4,121 | $23,445 | $7,200 | $16,245 |
| 2022 | $4,121 | $23,445 | $7,200 | $16,245 |
| 2021 | $4,047 | $23,445 | $7,200 | $16,245 |
| 2020 | $4,619 | $23,824 | $4,500 | $19,324 |
| 2019 | $4,632 | $26,472 | $4,500 | $21,972 |
| 2018 | $4,553 | $26,472 | $4,500 | $21,972 |
| 2017 | $4,588 | $24,675 | $3,960 | $20,715 |
| 2016 | $4,444 | $24,675 | $3,960 | $20,715 |
| 2015 | $4,043 | $24,675 | $3,960 | $20,715 |
| 2014 | $3,599 | $21,950 | $3,600 | $18,350 |
| 2013 | $3,516 | $21,950 | $3,600 | $18,350 |
Source: Public Records
Map
Nearby Homes
- 8350 W Addison St Unit 101
- 8159 W Forest Preserve Ave
- 3345 N Pittsburgh Ave
- 3759 N Pioneer Ave
- 3349 N Paris Ave
- 3419 N Panama Ave
- 3842 N Paris Ave
- 3207 N Pontiac Ave Unit 2S
- 3643 N Pacific Ave
- 3916 N Pontiac Ave
- 8216 W Belmont Ave Unit 1CTR
- 3826 N Page Ave
- 3725 N Pacific Ave
- 8245 Belmont Ave Unit 2C
- 8245 W Belmont Ave Unit 4G
- 8245 W Belmont Ave Unit 4B
- 3121 Paris Ave Unit 304
- 3300 N Osage Ave
- 3251 N Osage Ave
- 3231 N Osage Ave
- 3543 N Pontiac Ave
- 8319 W Addison St
- 8321 W Addison St
- 3535 N Pontiac Ave
- 8325 W Addison St
- 8315 W Addison St
- 8309 W Addison St
- 3544 N Plainfield Ave
- 3531 N Pontiac Ave
- 8307 W Addison St
- 3540 N Plainfield Ave
- 3536 N Plainfield Ave
- 8305 W Addison St
- 3529 N Pontiac Ave
- 3534 N Plainfield Ave
- 8301 W Addison St
- 3530 N Plainfield Ave
- 3525 N Pontiac Ave
- 3528 N Plainfield Ave
- 3523 N Pontiac Ave