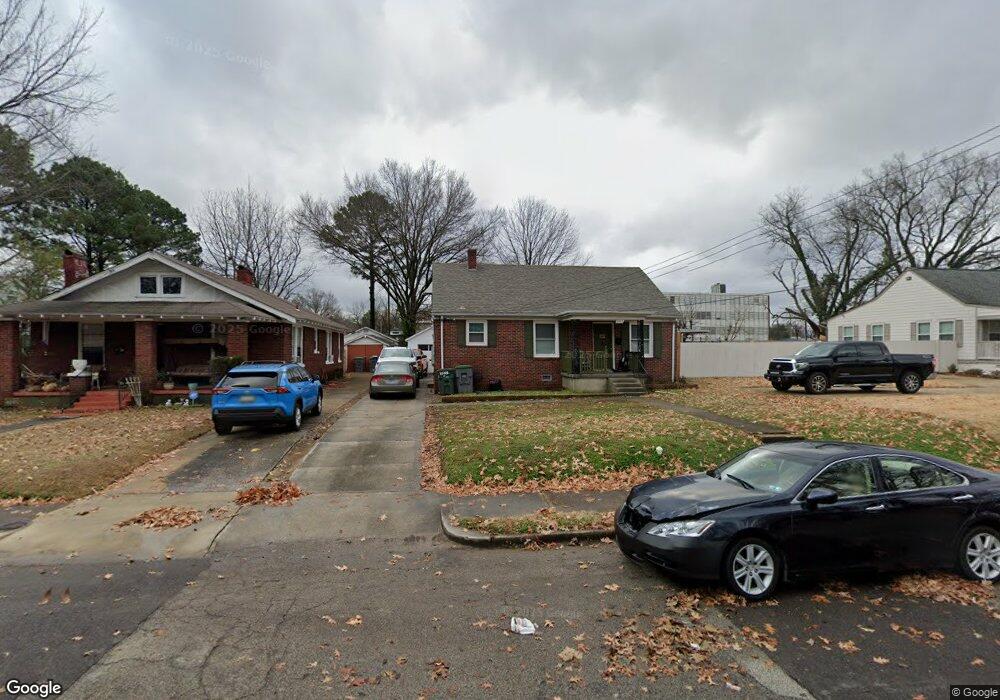
3553 Faxon Ave Memphis, TN 38122
Berclair NeighborhoodEstimated Value: $70,000 - $107,000
2
Beds
1
Bath
955
Sq Ft
$99/Sq Ft
Est. Value
About This Home
This home is located at 3553 Faxon Ave, Memphis, TN 38122 and is currently estimated at $94,440, approximately $98 per square foot. 3553 Faxon Ave is a home located in Shelby County with nearby schools including Grahamwood Elementary School, Treadwell Middle School, and Kingsbury High School.
Ownership History
Date
Name
Owned For
Owner Type
Purchase Details
Closed on
Oct 24, 2023
Sold by
Hall Laurence
Bought by
Paccasassi Daniel
Current Estimated Value
Purchase Details
Closed on
Dec 4, 2009
Sold by
Federal National Mortgage Association
Bought by
Hall Laurence
Home Financials for this Owner
Home Financials are based on the most recent Mortgage that was taken out on this home.
Original Mortgage
$25,200
Interest Rate
5.01%
Mortgage Type
New Conventional
Purchase Details
Closed on
Jul 23, 2009
Sold by
Bursi Anthony
Bought by
Federal National Mortgage Association
Purchase Details
Closed on
Feb 28, 2007
Sold by
Moore James R and Moore Tracie
Bought by
Bursi Anthony
Home Financials for this Owner
Home Financials are based on the most recent Mortgage that was taken out on this home.
Original Mortgage
$59,000
Interest Rate
6.19%
Mortgage Type
Purchase Money Mortgage
Purchase Details
Closed on
Jan 12, 2005
Sold by
Moore Tracie
Bought by
Moore James R
Create a Home Valuation Report for This Property
The Home Valuation Report is an in-depth analysis detailing your home's value as well as a comparison with similar homes in the area
Home Values in the Area
Average Home Value in this Area
Purchase History
| Date | Buyer | Sale Price | Title Company |
|---|---|---|---|
| Paccasassi Daniel | $100,000 | Lendserv National Title | |
| Hall Laurence | $31,500 | None Available | |
| Federal National Mortgage Association | $67,175 | None Available | |
| Bursi Anthony | $59,000 | American Title Company Inc | |
| Moore James R | $52,000 | -- |
Source: Public Records
Mortgage History
| Date | Status | Borrower | Loan Amount |
|---|---|---|---|
| Previous Owner | Hall Laurence | $25,200 | |
| Previous Owner | Bursi Anthony | $59,000 |
Source: Public Records
Tax History Compared to Growth
Tax History
| Year | Tax Paid | Tax Assessment Tax Assessment Total Assessment is a certain percentage of the fair market value that is determined by local assessors to be the total taxable value of land and additions on the property. | Land | Improvement |
|---|---|---|---|---|
| 2025 | $436 | $23,825 | $4,125 | $19,700 |
| 2024 | -- | $12,875 | $2,200 | $10,675 |
| 2023 | $784 | $12,875 | $2,200 | $10,675 |
| 2022 | $784 | $12,875 | $2,200 | $10,675 |
| 2021 | $794 | $12,875 | $2,200 | $10,675 |
| 2020 | $1,270 | $9,025 | $1,775 | $7,250 |
| 2019 | $654 | $9,025 | $1,775 | $7,250 |
| 2018 | $654 | $9,025 | $1,775 | $7,250 |
| 2017 | $371 | $9,025 | $1,775 | $7,250 |
| 2016 | $404 | $9,250 | $0 | $0 |
| 2014 | $404 | $9,250 | $0 | $0 |
Source: Public Records
Map
Nearby Homes
- 3550 Forrest Ave
- 3520 Bowen Ave
- 3682 Tutwiler Ave
- 3524 Autumn Ave
- 3725 Tutwiler Ave
- 3523 Autumn Ave
- 3556 Philwood Ave
- 3742 Charleston Square
- 802 Bowen Cir
- 3688 Philwood Ave
- 3786 Tutwiler Ave
- 3346 Faxon Ave
- 599 Isabelle St
- 475 N Highland St Unit 9AB
- 475 N Highland St Unit 8H
- 475 N Highland St Unit 7D
- 475 N Highland St Unit 12A B
- 475 N Highland St Unit 2K
- 475 N Highland St Unit 3H
- 475 N Highland St Unit 10J