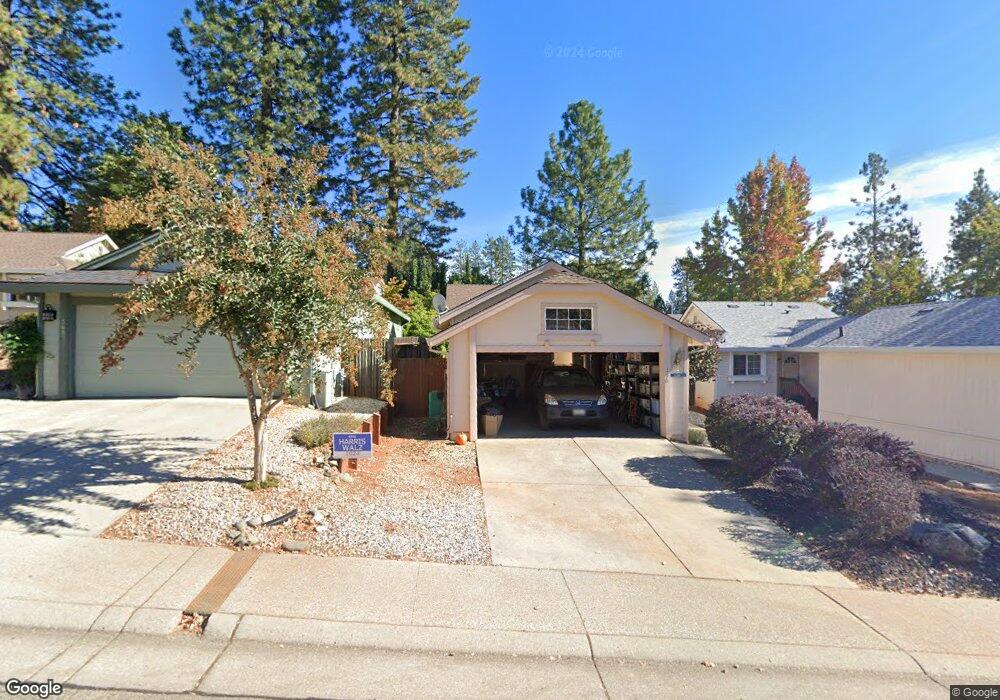
356 Horizon Cir Grass Valley, CA 95945
Estimated Value: $349,000 - $475,000
2
Beds
2
Baths
1,042
Sq Ft
$408/Sq Ft
Est. Value
About This Home
This home is located at 356 Horizon Cir, Grass Valley, CA 95945 and is currently estimated at $424,882, approximately $407 per square foot. 356 Horizon Cir is a home located in Nevada County with nearby schools including Deer Creek Elementary School, Seven Hills Intermediate School, and Yuba River Charter School.
Ownership History
Date
Name
Owned For
Owner Type
Purchase Details
Closed on
Nov 29, 2012
Sold by
Webb James D
Bought by
Webb James D and The James D Webb Revocable Liv
Current Estimated Value
Purchase Details
Closed on
Jul 12, 2011
Sold by
Westlake Douglas E and The Zella S Combs Irrevocable
Bought by
Webb James D
Purchase Details
Closed on
Mar 31, 2011
Sold by
Combs Zella S
Bought by
Westlake Douglas E and The Zella S Combs Irrevocable
Purchase Details
Closed on
Aug 9, 1999
Sold by
Bradshaw Sophia M
Bought by
Combs Zella S
Purchase Details
Closed on
Oct 2, 1997
Sold by
Mahan Leroy F and Mahan Vicki J
Bought by
Combs Zella S and Bradshaw Sophia M
Home Financials for this Owner
Home Financials are based on the most recent Mortgage that was taken out on this home.
Original Mortgage
$120,000
Interest Rate
7.54%
Create a Home Valuation Report for This Property
The Home Valuation Report is an in-depth analysis detailing your home's value as well as a comparison with similar homes in the area
Home Values in the Area
Average Home Value in this Area
Purchase History
| Date | Buyer | Sale Price | Title Company |
|---|---|---|---|
| Webb James D | -- | None Available | |
| Webb James D | $200,000 | Placer Title Company | |
| Westlake Douglas E | -- | None Available | |
| Combs Zella S | -- | -- | |
| Combs Zella S | $150,000 | Placer Title Company |
Source: Public Records
Mortgage History
| Date | Status | Borrower | Loan Amount |
|---|---|---|---|
| Previous Owner | Combs Zella S | $120,000 |
Source: Public Records
Tax History Compared to Growth
Tax History
| Year | Tax Paid | Tax Assessment Tax Assessment Total Assessment is a certain percentage of the fair market value that is determined by local assessors to be the total taxable value of land and additions on the property. | Land | Improvement |
|---|---|---|---|---|
| 2025 | $2,744 | $251,199 | $75,357 | $175,842 |
| 2024 | $2,692 | $246,275 | $73,880 | $172,395 |
| 2023 | $2,692 | $241,447 | $72,432 | $169,015 |
| 2022 | $2,635 | $236,713 | $71,012 | $165,701 |
| 2021 | $2,554 | $232,072 | $69,620 | $162,452 |
| 2020 | $2,549 | $229,694 | $68,907 | $160,787 |
| 2019 | $2,498 | $225,191 | $67,556 | $157,635 |
| 2018 | $0 | $220,777 | $66,232 | $154,545 |
| 2017 | $2,403 | $216,449 | $64,934 | $151,515 |
| 2016 | $2,316 | $212,206 | $63,661 | $148,545 |
| 2015 | $2,284 | $209,019 | $62,705 | $146,314 |
| 2014 | $2,251 | $204,925 | $61,477 | $143,448 |
Source: Public Records
Map
Nearby Homes
- 195 Northridge Dr
- 210 Elysian Place
- 196 Northridge Dr
- 139 Woodcrest Way
- 167 Northridge Dr
- 118 Sierra Blanca Ct
- 124 Ruby Ledge Ct
- 768 Morgan Ranch Dr
- 11912 Deer Park Dr
- 254 Bresee Place
- 241 Ryans Ln
- 107 Egret Place
- 111 Egret Place
- 145 Upper Slate Creek Rd
- 12921 Slate Creek Rd
- 215 Mallard Dr
- 12404 Deer Park Dr
- 11208 Ridge Rd
- 137 Cypress Hill Dr
- 153 Arcadia Dr