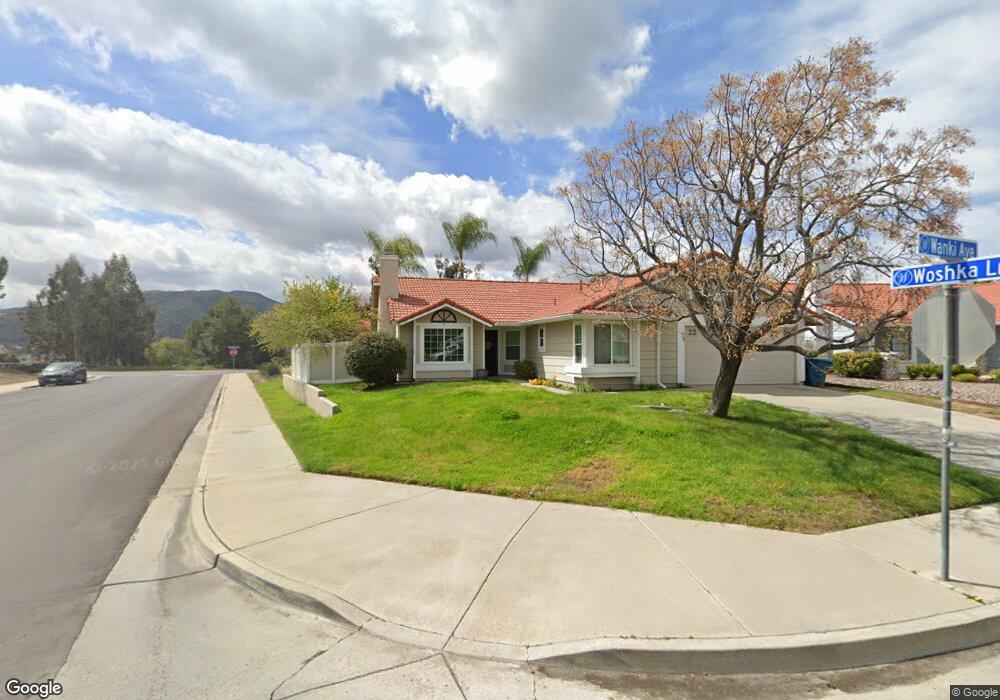
35699 Wanki Ave Wildomar, CA 92595
Estimated Value: $479,000 - $562,000
3
Beds
2
Baths
1,619
Sq Ft
$329/Sq Ft
Est. Value
About This Home
This home is located at 35699 Wanki Ave, Wildomar, CA 92595 and is currently estimated at $532,282, approximately $328 per square foot. 35699 Wanki Ave is a home located in Riverside County with nearby schools including Donald Graham Elementary School, David A. Brown Middle School, and Elsinore High School.
Ownership History
Date
Name
Owned For
Owner Type
Purchase Details
Closed on
Jan 9, 2020
Sold by
Davis Oliver W and Davis Jennifer S
Bought by
Davis Oliver W and Davis Jennifer S
Current Estimated Value
Purchase Details
Closed on
Oct 14, 1997
Sold by
Federal Home Loan Mortgage Corporation
Bought by
Davis Oliver W and Davis Jennifer
Home Financials for this Owner
Home Financials are based on the most recent Mortgage that was taken out on this home.
Original Mortgage
$109,150
Outstanding Balance
$17,598
Interest Rate
7.49%
Estimated Equity
$514,684
Purchase Details
Closed on
May 9, 1997
Sold by
Homeside Lending Inc
Bought by
Federal Home Loan Mortgage Corporation
Purchase Details
Closed on
May 8, 1997
Sold by
Swain John M and Swain Ronda S
Bought by
Homeside Lending Inc and Bancboston Mtg Corp
Create a Home Valuation Report for This Property
The Home Valuation Report is an in-depth analysis detailing your home's value as well as a comparison with similar homes in the area
Home Values in the Area
Average Home Value in this Area
Purchase History
| Date | Buyer | Sale Price | Title Company |
|---|---|---|---|
| Davis Oliver W | -- | None Available | |
| Davis Oliver W | $115,000 | First American Title Ins Co | |
| Federal Home Loan Mortgage Corporation | -- | First Southwestern Title Co | |
| Homeside Lending Inc | $111,000 | First Southwestern Title Co |
Source: Public Records
Mortgage History
| Date | Status | Borrower | Loan Amount |
|---|---|---|---|
| Open | Davis Oliver W | $109,150 |
Source: Public Records
Tax History
| Year | Tax Paid | Tax Assessment Tax Assessment Total Assessment is a certain percentage of the fair market value that is determined by local assessors to be the total taxable value of land and additions on the property. | Land | Improvement |
|---|---|---|---|---|
| 2025 | $4,434 | $187,096 | $56,981 | $130,115 |
| 2023 | $4,434 | $179,832 | $54,769 | $125,063 |
| 2022 | $4,373 | $176,307 | $53,696 | $122,611 |
| 2021 | $4,338 | $172,851 | $52,644 | $120,207 |
| 2020 | $4,274 | $171,080 | $52,105 | $118,975 |
| 2019 | $4,240 | $167,727 | $51,084 | $116,643 |
| 2018 | $4,201 | $164,439 | $50,084 | $114,355 |
| 2017 | $4,127 | $161,215 | $49,102 | $112,113 |
| 2016 | $4,084 | $158,055 | $48,140 | $109,915 |
| 2015 | $4,071 | $155,683 | $47,418 | $108,265 |
| 2014 | $4,019 | $152,636 | $46,490 | $106,146 |
Source: Public Records
Map
Nearby Homes
- 22866 Charles St
- 32245 Refa Ct
- 23025 Twinflower Ave
- 22956 Akwo Cir
- 23045 Twinflower Ave
- 35465 Woshka Ln
- 22628 Weatherly Ct
- 22711 Queensbury Ct
- 23095 Twinflower Ave
- 22864 Temet St
- 35616 Aster Dr
- 22981 Nan St
- 32545 Nelmar Cir
- 23272 Alta Oaks Dr
- 0 Palomar Rd Unit SW26014900
- 23057 Seattle Ridge Rd
- 21650 Pink Ginger Ct
- 0 Wildomar Trail
- 23777 Wildomar Trail
- 36237 Sunset Ridge Ct
- 35685 Wanki Ave
- 35682 Charles St
- 35668 Charles St
- 35671 Wanki Ave
- 22776 Charles St
- 35690 Woshka Ln
- 35661 Woshka Ln
- 35708 Woshka Ln
- 35654 Ruth Ave
- 35657 Wanki Ave
- 35662 Woshka Ln
- 35651 Woshka Ln
- 22819 Showut Ave
- 35656 Wanki Ave
- 22816 Charles St
- 35646 Ruth Ave
- 35650 Woshka Ln
- 35643 Wanki Ave
- 35642 Wanki Ave
- 35641 Kolo Ct
Your Personal Tour Guide
Ask me questions while you tour the home.