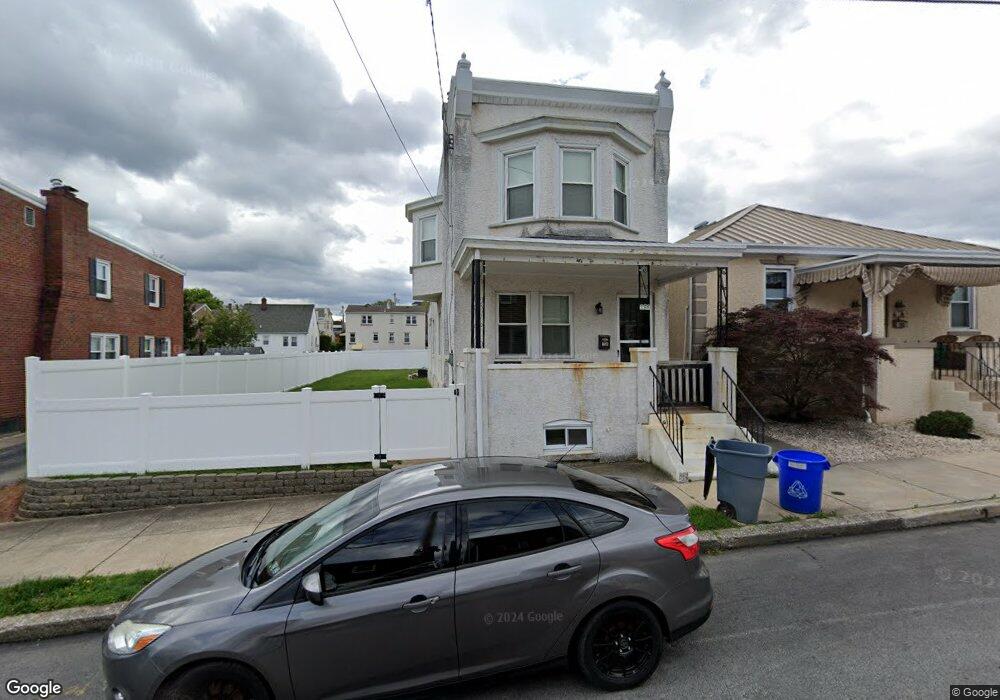
358 Hurst St Bridgeport, PA 19405
Estimated Value: $351,000 - $400,000
3
Beds
1
Bath
1,673
Sq Ft
$218/Sq Ft
Est. Value
About This Home
This home is located at 358 Hurst St, Bridgeport, PA 19405 and is currently estimated at $364,684, approximately $217 per square foot. 358 Hurst St is a home located in Montgomery County with nearby schools including Bridgeport Elementary School, Upper Merion Middle School, and Upper Merion High School.
Ownership History
Date
Name
Owned For
Owner Type
Purchase Details
Closed on
Dec 16, 2019
Sold by
Melle John
Bought by
Melle John and Melle Alayna
Current Estimated Value
Purchase Details
Closed on
Jan 30, 2009
Sold by
Dibussolo Elena Degisi and Reynolds Lucia Degisi
Bought by
Melle John
Home Financials for this Owner
Home Financials are based on the most recent Mortgage that was taken out on this home.
Original Mortgage
$180,175
Outstanding Balance
$113,648
Interest Rate
5.06%
Estimated Equity
$251,036
Purchase Details
Closed on
Jul 26, 2006
Sold by
Degisi Pasquale and Degisi Maria R
Bought by
Degisi Orazio G and Dibussolo Elena Degisi
Create a Home Valuation Report for This Property
The Home Valuation Report is an in-depth analysis detailing your home's value as well as a comparison with similar homes in the area
Home Values in the Area
Average Home Value in this Area
Purchase History
| Date | Buyer | Sale Price | Title Company |
|---|---|---|---|
| Melle John | -- | None Available | |
| Melle John | $183,500 | None Available | |
| Degisi Orazio G | -- | None Available |
Source: Public Records
Mortgage History
| Date | Status | Borrower | Loan Amount |
|---|---|---|---|
| Open | Melle John | $180,175 |
Source: Public Records
Tax History Compared to Growth
Tax History
| Year | Tax Paid | Tax Assessment Tax Assessment Total Assessment is a certain percentage of the fair market value that is determined by local assessors to be the total taxable value of land and additions on the property. | Land | Improvement |
|---|---|---|---|---|
| 2025 | $3,590 | $91,090 | $38,720 | $52,370 |
| 2024 | $3,590 | $91,090 | $38,720 | $52,370 |
| 2023 | $3,491 | $91,090 | $38,720 | $52,370 |
| 2022 | $3,398 | $91,090 | $38,720 | $52,370 |
| 2021 | $3,371 | $91,090 | $38,720 | $52,370 |
| 2020 | $3,317 | $91,090 | $38,720 | $52,370 |
| 2019 | $3,276 | $91,090 | $38,720 | $52,370 |
| 2018 | $3,277 | $91,090 | $38,720 | $52,370 |
| 2017 | $3,192 | $91,090 | $38,720 | $52,370 |
| 2016 | $3,156 | $91,090 | $38,720 | $52,370 |
| 2015 | $3,073 | $91,090 | $38,720 | $52,370 |
| 2014 | $3,073 | $91,090 | $38,720 | $52,370 |
Source: Public Records
Map
Nearby Homes