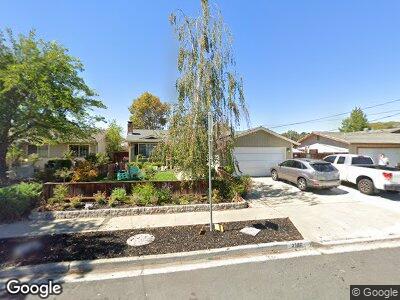
3586 Hillsborough Dr Concord, CA 94520
Sun Terrace NeighborhoodEstimated Value: $729,000 - $845,000
5
Beds
3
Baths
1,571
Sq Ft
$488/Sq Ft
Est. Value
About This Home
This home is located at 3586 Hillsborough Dr, Concord, CA 94520 and is currently estimated at $766,368, approximately $487 per square foot. 3586 Hillsborough Dr is a home located in Contra Costa County with nearby schools including Sun Terrace Elementary School, El Dorado Middle School, and Mt. Diablo High School.
Ownership History
Date
Name
Owned For
Owner Type
Purchase Details
Closed on
Aug 1, 2016
Sold by
Brien Kathleen O
Bought by
Jaureque Danny P
Current Estimated Value
Home Financials for this Owner
Home Financials are based on the most recent Mortgage that was taken out on this home.
Original Mortgage
$515,490
Interest Rate
3.41%
Mortgage Type
FHA
Purchase Details
Closed on
Jan 17, 2012
Sold by
Bank Of America Na
Bought by
Obrien Kathleen
Purchase Details
Closed on
Jun 17, 2011
Sold by
Hubbard Wei Lei
Bought by
Bac Home Loan Servicing Lp
Purchase Details
Closed on
Aug 2, 2007
Sold by
Coach William F
Bought by
Hubbard Wei Lei
Home Financials for this Owner
Home Financials are based on the most recent Mortgage that was taken out on this home.
Original Mortgage
$96,000
Interest Rate
6.61%
Mortgage Type
Credit Line Revolving
Purchase Details
Closed on
Jan 30, 2001
Sold by
Coach William Frank
Bought by
Coach William F
Create a Home Valuation Report for This Property
The Home Valuation Report is an in-depth analysis detailing your home's value as well as a comparison with similar homes in the area
Home Values in the Area
Average Home Value in this Area
Purchase History
| Date | Buyer | Sale Price | Title Company |
|---|---|---|---|
| Jaureque Danny P | $525,000 | Chicago Title Company | |
| Obrien Kathleen | $230,000 | Landsafe | |
| Bac Home Loan Servicing Lp | $436,952 | Fidelity National Title Grou | |
| Hubbard Wei Lei | $540,000 | Financial Title Company | |
| Coach William F | -- | -- |
Source: Public Records
Mortgage History
| Date | Status | Borrower | Loan Amount |
|---|---|---|---|
| Open | Jaureque Danny P | $573,750 | |
| Closed | Jaureque Danny P | $484,000 | |
| Closed | Jaureque Danny P | $515,490 | |
| Previous Owner | Hubbard Wei Lei | $96,000 | |
| Previous Owner | Hubbard Wei Lei | $432,000 |
Source: Public Records
Tax History Compared to Growth
Tax History
| Year | Tax Paid | Tax Assessment Tax Assessment Total Assessment is a certain percentage of the fair market value that is determined by local assessors to be the total taxable value of land and additions on the property. | Land | Improvement |
|---|---|---|---|---|
| 2024 | $7,317 | $597,356 | $307,211 | $290,145 |
| 2023 | $7,317 | $585,644 | $301,188 | $284,456 |
| 2022 | $7,218 | $574,162 | $295,283 | $278,879 |
| 2021 | $7,038 | $562,905 | $289,494 | $273,411 |
| 2019 | $9,823 | $546,210 | $280,908 | $265,302 |
| 2018 | $9,555 | $535,500 | $275,400 | $260,100 |
| 2017 | $7,634 | $525,000 | $270,000 | $255,000 |
| 2016 | $3,338 | $244,036 | $159,154 | $84,882 |
| 2015 | $3,279 | $240,371 | $156,764 | $83,607 |
| 2014 | $3,203 | $235,664 | $153,694 | $81,970 |
Source: Public Records
Map
Nearby Homes
- 3533 Hillsborough Dr
- 3670 Vancouver Way
- 3459 Cranbrook Way
- 3453 Thunderbird Dr
- 3640 Northwood Dr Unit G
- 3650 Northwood Dr Unit B
- 3300 Northwood Dr Unit D
- 3360 Northwood Dr Unit D
- 83 A St
- 120 A St
- 2155 Northwood Cir Unit D
- 2279 Saint George Dr
- 2165 Northwood Cir Unit B
- 3549 Dormer Ave
- 2131 Northwood Cir Unit C
- 2125 Northwood Cir Unit H
- 3665 Sun View Way
- 2512 Montgomery Ave
- 3636 Dormer Ave
- 2361 Panoramic Dr
- 3586 Hillsborough Dr
- 3592 Hillsborough Dr
- 3580 Hillsborough Dr
- 3587 Halifax Way
- 3581 Halifax Way
- 3593 Halifax Way
- 3575 Halifax Way
- 3599 Halifax Way
- 3587 Hillsborough Dr
- 3581 Hillsborough Dr
- 3604 Hillsborough Dr
- 3568 Hillsborough Dr
- 3575 Hillsborough Dr
- 3569 Halifax Way
- 3605 Halifax Way
- 3601 Hillsborough Dr
- 3569 Hillsborough Dr
- 3562 Hillsborough Dr
- 3610 Hillsborough Dr
- 2281 Floyd Ln