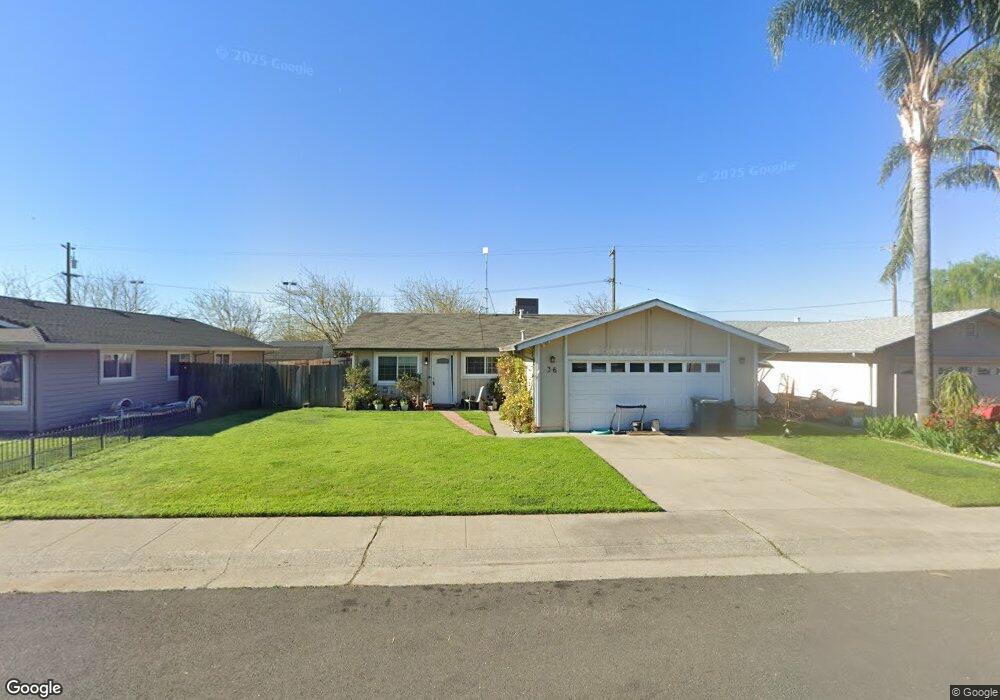
36 4th Ave Isleton, CA 95641
Estimated Value: $283,000 - $383,000
4
Beds
2
Baths
1,280
Sq Ft
$265/Sq Ft
Est. Value
About This Home
This home is located at 36 4th Ave, Isleton, CA 95641 and is currently estimated at $339,715, approximately $265 per square foot. 36 4th Ave is a home with nearby schools including Isleton Elementary School, Riverview Middle School, and Rio Vista High School.
Ownership History
Date
Name
Owned For
Owner Type
Purchase Details
Closed on
Jul 20, 2018
Sold by
Hilliker Donald Paul
Bought by
Hilliker Porcia
Current Estimated Value
Purchase Details
Closed on
May 18, 2001
Sold by
Cardenas Porcia Renee and Lindstrom Porcia Renee
Bought by
Cardenas Porcia Renee
Home Financials for this Owner
Home Financials are based on the most recent Mortgage that was taken out on this home.
Original Mortgage
$108,000
Outstanding Balance
$39,215
Interest Rate
7.15%
Mortgage Type
Purchase Money Mortgage
Estimated Equity
$300,500
Purchase Details
Closed on
Jul 14, 1995
Sold by
Hud
Bought by
Lindstrom Porcia Renee
Home Financials for this Owner
Home Financials are based on the most recent Mortgage that was taken out on this home.
Original Mortgage
$91,104
Interest Rate
7.74%
Mortgage Type
FHA
Purchase Details
Closed on
Apr 10, 1995
Sold by
Fleet Mtg Corp
Bought by
Hud
Create a Home Valuation Report for This Property
The Home Valuation Report is an in-depth analysis detailing your home's value as well as a comparison with similar homes in the area
Purchase History
| Date | Buyer | Sale Price | Title Company |
|---|---|---|---|
| Hilliker Porcia | -- | Title365 | |
| Hilliker Porcia | -- | Title365 | |
| Cardenas Porcia Renee | -- | American Title Co | |
| Lindstrom Porcia Renee | $92,000 | Stewart Title | |
| Hud | -- | Fidelity National Title Ins | |
| Fleet Mtg Corp | $119,365 | Fidelity National Title Ins |
Source: Public Records
Mortgage History
| Date | Status | Borrower | Loan Amount |
|---|---|---|---|
| Open | Cardenas Porcia Renee | $108,000 | |
| Closed | Lindstrom Porcia Renee | $91,104 |
Source: Public Records
Tax History
| Year | Tax Paid | Tax Assessment Tax Assessment Total Assessment is a certain percentage of the fair market value that is determined by local assessors to be the total taxable value of land and additions on the property. | Land | Improvement |
|---|---|---|---|---|
| 2025 | $1,605 | $152,804 | $58,128 | $94,676 |
| 2024 | $1,605 | $149,809 | $56,989 | $92,820 |
| 2023 | $1,592 | $146,872 | $55,872 | $91,000 |
| 2022 | $1,565 | $143,993 | $54,777 | $89,216 |
| 2021 | $1,517 | $141,170 | $53,703 | $87,467 |
| 2020 | $1,454 | $139,724 | $53,153 | $86,571 |
| 2019 | $1,400 | $136,985 | $52,111 | $84,874 |
| 2018 | $1,432 | $134,300 | $51,090 | $83,210 |
| 2017 | $1,358 | $131,668 | $50,089 | $81,579 |
| 2016 | $1,334 | $129,087 | $49,107 | $79,980 |
| 2015 | $1,519 | $127,149 | $48,370 | $78,779 |
| 2014 | $1,401 | $124,659 | $47,423 | $77,236 |
Source: Public Records
Map
Nearby Homes
- 30 3rd Ave
- 25 4th Ave
- 330 Jackson Boulevard Extension
- 9 4th Ave
- 0 California 160
- 301 B St
- 00 Brannan Isle Rd
- 608 Union St
- 612 Union St
- 414 F St
- 39 Main St
- 0 6th St
- 0 6th St
- 58 Main St
- 706 Anne Marie Way
- 525 Brannan Isle
- 16073 Totem Dr
- 1777 Circle Dr
- 16637 Tyler Island Rd
- 665 W Tyler Island Bridge Rd
Your Personal Tour Guide
Ask me questions while you tour the home.