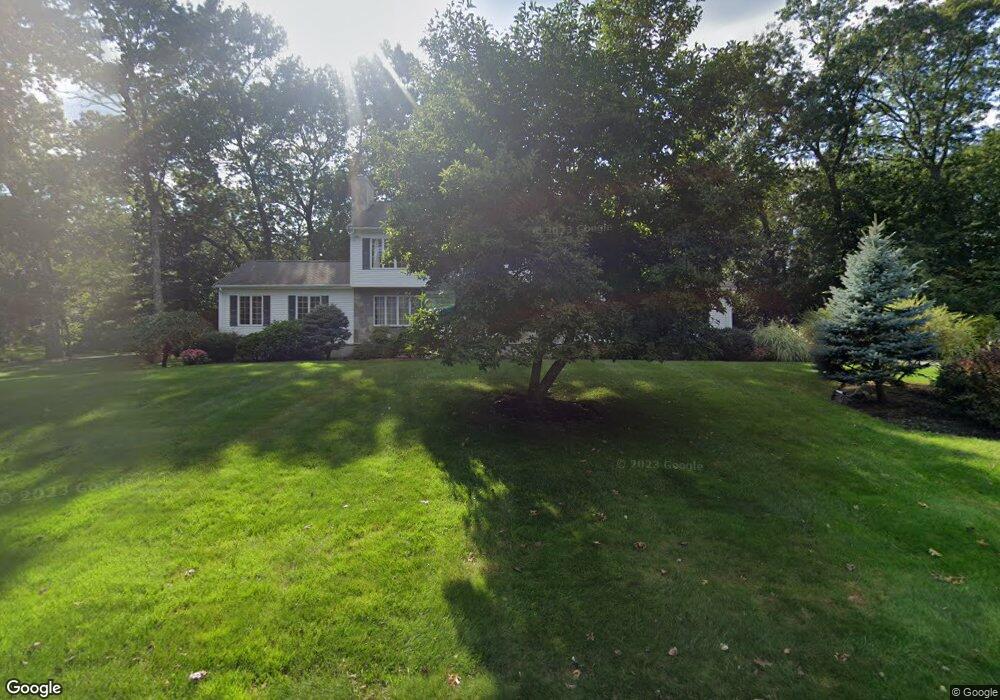
36 Algonquin Ave Andover, MA 01810
West Andover NeighborhoodEstimated Value: $1,130,000 - $1,608,000
4
Beds
4
Baths
3,800
Sq Ft
$380/Sq Ft
Est. Value
About This Home
This home is located at 36 Algonquin Ave, Andover, MA 01810 and is currently estimated at $1,445,777, approximately $380 per square foot. 36 Algonquin Ave is a home located in Essex County with nearby schools including Henry C. Sanborn Elementary School, Andover West Middle School, and Andover High School.
Ownership History
Date
Name
Owned For
Owner Type
Purchase Details
Closed on
Apr 4, 2011
Sold by
Alpert Scott and Alpert Carlene Merola
Bought by
Scott Alpert 2011 Ret and Alpert Scott
Current Estimated Value
Purchase Details
Closed on
Jul 30, 2004
Sold by
Dexter Sharon L and Dexter Warin H
Bought by
Alpert Carlene Merola and Alpert Scott W
Purchase Details
Closed on
Jan 31, 1994
Sold by
Chen Willis
Bought by
Mack Rt
Create a Home Valuation Report for This Property
The Home Valuation Report is an in-depth analysis detailing your home's value as well as a comparison with similar homes in the area
Home Values in the Area
Average Home Value in this Area
Purchase History
| Date | Buyer | Sale Price | Title Company |
|---|---|---|---|
| Scott Alpert 2011 Ret | -- | -- | |
| Scott Alpert 2011 Ret | -- | -- | |
| Alpert Carlene Merola | $730,000 | -- | |
| Alpert Carlene Merola | $730,000 | -- | |
| Mack Rt | $387,000 | -- | |
| Mack Rt | $387,000 | -- |
Source: Public Records
Mortgage History
| Date | Status | Borrower | Loan Amount |
|---|---|---|---|
| Open | Mack Rt | $285,264 | |
| Previous Owner | Mack Rt | $305,000 |
Source: Public Records
Tax History
| Year | Tax Paid | Tax Assessment Tax Assessment Total Assessment is a certain percentage of the fair market value that is determined by local assessors to be the total taxable value of land and additions on the property. | Land | Improvement |
|---|---|---|---|---|
| 2024 | $16,477 | $1,279,300 | $635,800 | $643,500 |
| 2023 | $15,801 | $1,156,700 | $572,700 | $584,000 |
| 2022 | $14,905 | $1,020,900 | $498,000 | $522,900 |
| 2021 | $14,307 | $935,700 | $452,600 | $483,100 |
| 2020 | $13,773 | $917,600 | $441,500 | $476,100 |
| 2019 | $13,758 | $901,000 | $428,700 | $472,300 |
| 2018 | $13,277 | $848,900 | $412,200 | $436,700 |
| 2017 | $12,744 | $839,500 | $403,900 | $435,600 |
| 2016 | $12,474 | $841,700 | $403,900 | $437,800 |
| 2015 | $12,033 | $803,800 | $388,200 | $415,600 |
Source: Public Records
Map
Nearby Homes
- 11 Rennie Dr
- 1 Delisio Dr
- 6 Hearthstone Place
- 241 Lowell St Unit 3
- 2 Garfield Ln W
- 18 Dale St Unit 9D
- 15 Geneva Rd
- 14 Geneva Rd
- 6 Exeter Way
- 72 Tewksbury St
- 8 Stouffer Cir
- 105 Central St
- 58 Blanchard St
- 14 Jill's Way Unit 14
- 54 Birch Rd
- 22 Haggetts Pond Rd
- 3 Torr St
- 37 Crenshaw Ln Unit 37
- 31 Crenshaw Ln Unit 31
- 3 Caileigh Ct
- 8 Comanche Place
- 38 Algonquin Ave
- 32 Algonquin Ave
- 35 Algonquin Ave
- 37 Algonquin Ave
- 5 Iroquois Ave
- 7 Comanche Place
- 33 Algonquin Ave
- 6 Comanche Place
- 39 Algonquin Ave
- 30 Algonquin Ave
- 5 Comanche Place
- 31 Algonquin Ave
- 3 Iroquois Ave
- 6 Iroquois Ave
- 4 Comanche Place
- 4 Iroquois Ave
- 8 Iroquois Ave
- 1 Seminole Cir
- 3 Comanche Place
Your Personal Tour Guide
Ask me questions while you tour the home.