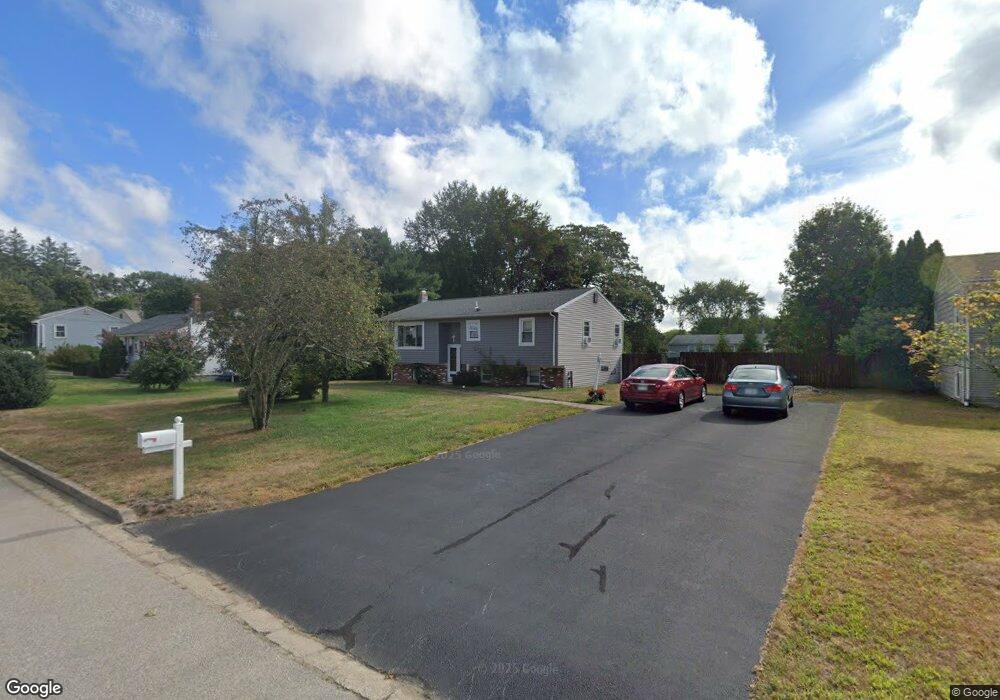
36 Bratt Ln West Warwick, RI 02893
Crompton NeighborhoodEstimated Value: $401,779 - $478,000
3
Beds
2
Baths
1,920
Sq Ft
$224/Sq Ft
Est. Value
About This Home
This home is located at 36 Bratt Ln, West Warwick, RI 02893 and is currently estimated at $430,445, approximately $224 per square foot. 36 Bratt Ln is a home located in Kent County with nearby schools including West Warwick High School and Father John V. Doyle School.
Ownership History
Date
Name
Owned For
Owner Type
Purchase Details
Closed on
Apr 23, 2013
Sold by
Iadevaia Renee M
Bought by
Iadevaia Renee M and Iadevaia Anthony J
Current Estimated Value
Purchase Details
Closed on
Mar 18, 2013
Sold by
Sullivan Renee M
Bought by
Iadevaia Renee M
Purchase Details
Closed on
Aug 17, 2004
Sold by
Garcia Joseph R
Bought by
Sullivan Renee M
Home Financials for this Owner
Home Financials are based on the most recent Mortgage that was taken out on this home.
Original Mortgage
$224,000
Interest Rate
6.16%
Mortgage Type
Purchase Money Mortgage
Purchase Details
Closed on
Jun 23, 2003
Sold by
Fournier Denis G and Fournier Paula M
Bought by
Grarcia Joseph R
Purchase Details
Closed on
Nov 25, 1998
Sold by
Macrae Shirley M
Bought by
Fournier Denis G and Bearse Lorraine
Purchase Details
Closed on
Apr 28, 1992
Sold by
Reynolds Ralph
Bought by
Gallant Lynne
Create a Home Valuation Report for This Property
The Home Valuation Report is an in-depth analysis detailing your home's value as well as a comparison with similar homes in the area
Home Values in the Area
Average Home Value in this Area
Purchase History
| Date | Buyer | Sale Price | Title Company |
|---|---|---|---|
| Iadevaia Renee M | -- | -- | |
| Iadevaia Renee M | -- | -- | |
| Sullivan Renee M | $280,000 | -- | |
| Grarcia Joseph R | $206,000 | -- | |
| Fournier Denis G | $109,000 | -- | |
| Gallant Lynne | $113,000 | -- |
Source: Public Records
Mortgage History
| Date | Status | Borrower | Loan Amount |
|---|---|---|---|
| Previous Owner | Gallant Lynne | $224,000 | |
| Previous Owner | Gallant Lynne | $42,000 |
Source: Public Records
Tax History Compared to Growth
Tax History
| Year | Tax Paid | Tax Assessment Tax Assessment Total Assessment is a certain percentage of the fair market value that is determined by local assessors to be the total taxable value of land and additions on the property. | Land | Improvement |
|---|---|---|---|---|
| 2025 | $4,516 | $316,000 | $121,100 | $194,900 |
| 2024 | $4,501 | $240,800 | $95,700 | $145,100 |
| 2023 | $4,411 | $240,800 | $95,700 | $145,100 |
| 2022 | $4,344 | $240,800 | $95,700 | $145,100 |
| 2021 | $4,720 | $205,200 | $76,500 | $128,700 |
| 2020 | $4,720 | $205,200 | $76,500 | $128,700 |
| 2019 | $6,016 | $205,200 | $76,500 | $128,700 |
| 2018 | $4,234 | $160,300 | $74,300 | $86,000 |
| 2017 | $4,217 | $160,300 | $74,300 | $86,000 |
| 2016 | $4,142 | $160,300 | $74,300 | $86,000 |
| 2015 | $4,104 | $158,100 | $74,300 | $83,800 |
| 2014 | $4,014 | $158,100 | $74,300 | $83,800 |
Source: Public Records
Map
Nearby Homes
- 25 Scenic Dr
- 105 Scenic Dr
- 0 New London Turnpike
- 11 Drawbridge Dr
- 25 Wescott Way Unit 80
- 65 Angus St
- 1 Hampton Rd Unit 27
- 19 Hampton Rd Unit 69
- 32 Wescott Way Unit 53
- 40 Wescott Way Unit 57
- 15 Hampton Rd Unit 20
- 194 Kimberly Ln
- 99 Silverwood Ln
- 211 Tiogue Ave
- 34 Silverwood Ln
- 1785 Division Rd
- 215 Watch Hill Dr
- 40 E Greenwich Ave
- 0 James P Murphy Ind Hwy
- 25 Fawn Ln