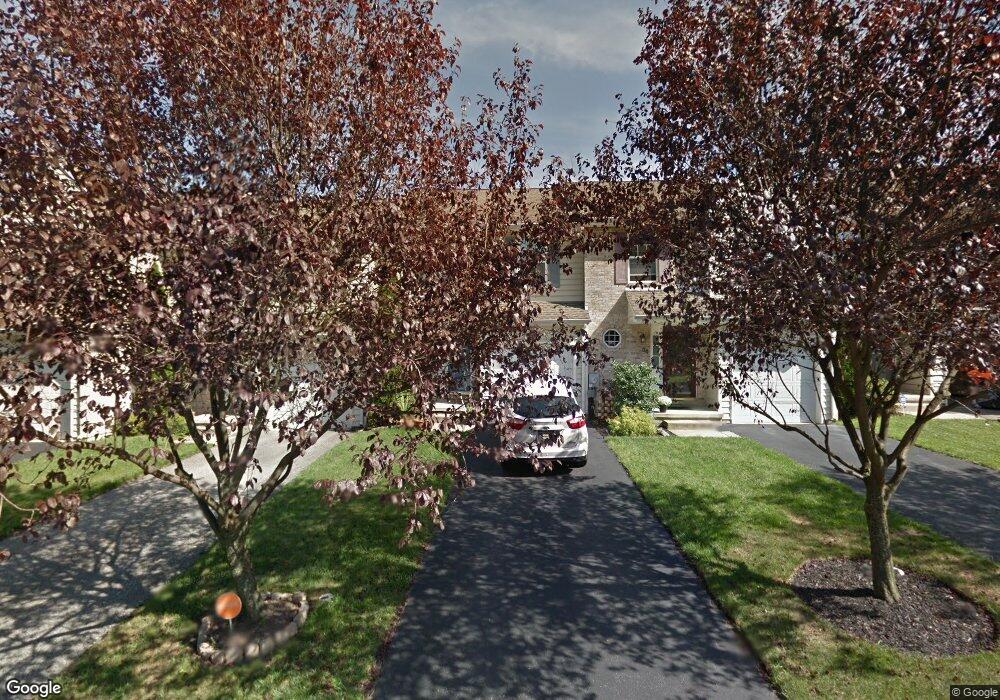
36 Brier Ave Wilmington, DE 19805
Estimated Value: $320,000 - $346,000
3
Beds
3
Baths
1,529
Sq Ft
$217/Sq Ft
Est. Value
About This Home
This home is located at 36 Brier Ave, Wilmington, DE 19805 and is currently estimated at $331,789, approximately $216 per square foot. 36 Brier Ave is a home located in New Castle County with nearby schools including Austin D. Baltz Elementary School, Alexis I. du Pont Middle School, and Thomas McKean High School.
Ownership History
Date
Name
Owned For
Owner Type
Purchase Details
Closed on
Apr 11, 2024
Sold by
Johnson Mei Ling In
Bought by
Mei-Ling Johnson-Eckman And Matthew Thomas Ec and Johnson-Eckman
Current Estimated Value
Purchase Details
Closed on
Sep 28, 2006
Sold by
Carter Timothy B and Carter Carolyn R
Bought by
Johnson Mei Ling In
Home Financials for this Owner
Home Financials are based on the most recent Mortgage that was taken out on this home.
Original Mortgage
$212,400
Interest Rate
6.52%
Mortgage Type
Purchase Money Mortgage
Purchase Details
Closed on
Mar 28, 2003
Sold by
Baldini Elsmere Llc
Bought by
Carter Timothy B and Carter Carolyn R
Home Financials for this Owner
Home Financials are based on the most recent Mortgage that was taken out on this home.
Original Mortgage
$155,208
Interest Rate
5.88%
Mortgage Type
Purchase Money Mortgage
Create a Home Valuation Report for This Property
The Home Valuation Report is an in-depth analysis detailing your home's value as well as a comparison with similar homes in the area
Home Values in the Area
Average Home Value in this Area
Purchase History
| Date | Buyer | Sale Price | Title Company |
|---|---|---|---|
| Mei-Ling Johnson-Eckman And Matthew Thomas Ec | -- | None Listed On Document | |
| Johnson Mei Ling In | $236,000 | None Available | |
| Carter Timothy B | $160,009 | -- |
Source: Public Records
Mortgage History
| Date | Status | Borrower | Loan Amount |
|---|---|---|---|
| Previous Owner | Johnson Mei Ling In | $212,400 | |
| Previous Owner | Carter Timothy B | $155,208 |
Source: Public Records
Tax History Compared to Growth
Tax History
| Year | Tax Paid | Tax Assessment Tax Assessment Total Assessment is a certain percentage of the fair market value that is determined by local assessors to be the total taxable value of land and additions on the property. | Land | Improvement |
|---|---|---|---|---|
| 2024 | $2,158 | $65,800 | $7,200 | $58,600 |
| 2023 | $1,880 | $65,800 | $7,200 | $58,600 |
| 2022 | $1,881 | $65,800 | $7,200 | $58,600 |
| 2021 | $1,828 | $65,800 | $7,200 | $58,600 |
| 2020 | $1,840 | $65,800 | $7,200 | $58,600 |
| 2019 | $2,061 | $65,800 | $7,200 | $58,600 |
| 2018 | $1,861 | $65,800 | $7,200 | $58,600 |
| 2017 | $1,854 | $65,800 | $7,200 | $58,600 |
| 2016 | $1,759 | $65,800 | $7,200 | $58,600 |
| 2015 | $1,632 | $65,800 | $7,200 | $58,600 |
| 2014 | $1,492 | $65,800 | $7,200 | $58,600 |
Source: Public Records
Map
Nearby Homes