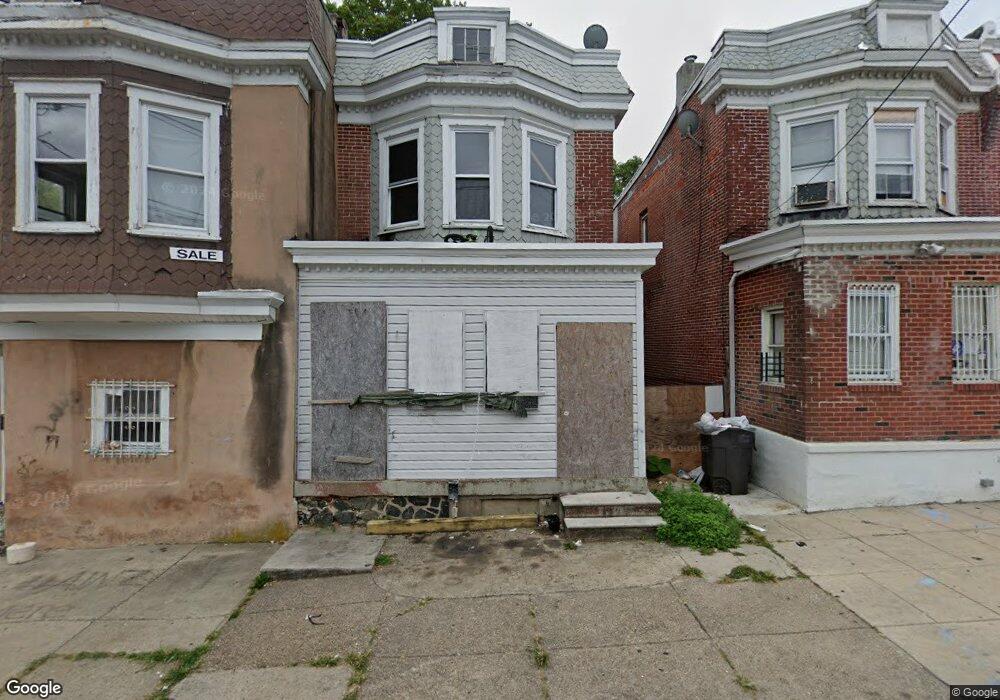
36 E 23rd St Wilmington, DE 19802
Brandywine Village NeighborhoodEstimated Value: $161,000 - $254,000
4
Beds
2
Baths
1,475
Sq Ft
$141/Sq Ft
Est. Value
About This Home
This home is located at 36 E 23rd St, Wilmington, DE 19802 and is currently estimated at $207,500, approximately $140 per square foot. 36 E 23rd St is a home located in New Castle County with nearby schools including Lombardy Elementary School, Springer Middle School, and Brandywine High School.
Ownership History
Date
Name
Owned For
Owner Type
Purchase Details
Closed on
Nov 17, 2023
Sold by
Jackson Tyrone
Bought by
Dh Land Holdings Llc
Current Estimated Value
Home Financials for this Owner
Home Financials are based on the most recent Mortgage that was taken out on this home.
Original Mortgage
$90,000
Interest Rate
7.79%
Mortgage Type
New Conventional
Purchase Details
Closed on
Aug 16, 2022
Sold by
Wilmington Neighborhood Conservancy Land
Bought by
Jackson Tyrone
Purchase Details
Closed on
Oct 4, 2017
Sold by
City Of Wilmington
Bought by
Wilmington Neighborhood Conservancy Land
Purchase Details
Closed on
Jul 9, 2015
Sold by
Cumberbatch Everson S and Cumberbatch Doretha
Bought by
City Of Wilmington
Purchase Details
Closed on
Jan 13, 2015
Bought by
City Of Wilmington
Create a Home Valuation Report for This Property
The Home Valuation Report is an in-depth analysis detailing your home's value as well as a comparison with similar homes in the area
Home Values in the Area
Average Home Value in this Area
Purchase History
| Date | Buyer | Sale Price | Title Company |
|---|---|---|---|
| Dh Land Holdings Llc | -- | None Listed On Document | |
| Jackson Tyrone | -- | None Listed On Document | |
| Wilmington Neighborhood Conservancy Land | -- | None Available | |
| City Of Wilmington | $10,500 | None Available | |
| City Of Wilmington | $10,500 | -- |
Source: Public Records
Mortgage History
| Date | Status | Borrower | Loan Amount |
|---|---|---|---|
| Closed | Dh Land Holdings Llc | $90,000 | |
| Closed | Jackson Tyrone | $0 |
Source: Public Records
Tax History Compared to Growth
Tax History
| Year | Tax Paid | Tax Assessment Tax Assessment Total Assessment is a certain percentage of the fair market value that is determined by local assessors to be the total taxable value of land and additions on the property. | Land | Improvement |
|---|---|---|---|---|
| 2024 | $850 | $26,300 | $2,000 | $24,300 |
| 2023 | $771 | $26,300 | $2,000 | $24,300 |
| 2022 | $0 | $26,300 | $2,000 | $24,300 |
| 2021 | $488 | $26,300 | $2,000 | $24,300 |
| 2020 | $488 | $26,300 | $2,000 | $24,300 |
| 2019 | $488 | $26,300 | $2,000 | $24,300 |
| 2018 | $0 | $26,300 | $2,000 | $24,300 |
| 2017 | $488 | $26,300 | $2,000 | $24,300 |
| 2016 | $488 | $26,300 | $2,000 | $24,300 |
| 2015 | $488 | $26,300 | $2,000 | $24,300 |
| 2014 | $488 | $26,300 | $2,000 | $24,300 |
Source: Public Records
Map
Nearby Homes