Estimated Value: $297,000 - $387,000
3
Beds
2
Baths
1,482
Sq Ft
$230/Sq Ft
Est. Value
About This Home
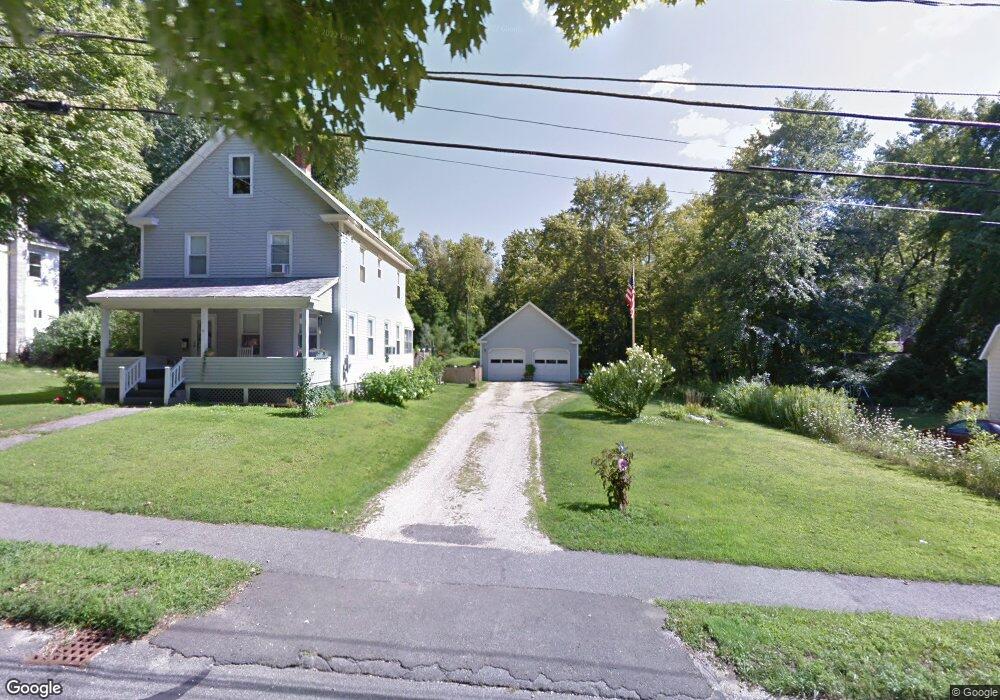
This home is located at 36 E Center St, Lee, MA 01238 and is currently estimated at $341,503, approximately $230 per square foot. 36 E Center St is a home located in Berkshire County with nearby schools including Lee Elementary School, Lee Middle/High School, and St. Mary's School.
Ownership History
Date
Name
Owned For
Owner Type
Purchase Details
Closed on
Dec 14, 2011
Sold by
Est Kelly Frances A and Kelly Mary T
Bought by
Leprevost Ryan M and Leprevost Holly R
Current Estimated Value
Home Financials for this Owner
Home Financials are based on the most recent Mortgage that was taken out on this home.
Original Mortgage
$202,727
Outstanding Balance
$142,665
Interest Rate
4.12%
Mortgage Type
FHA
Estimated Equity
$198,838
Purchase Details
Closed on
Aug 9, 1989
Sold by
Mcintyre Kathleen H
Bought by
Sullivan Daniel R
Create a Home Valuation Report for This Property
The Home Valuation Report is an in-depth analysis detailing your home's value as well as a comparison with similar homes in the area
Home Values in the Area
Average Home Value in this Area
Purchase History
We collect this data history from publicly available records. To have your information removed, we recommend requesting removal directly through your county’s website.
| Date | Buyer | Sale Price | Title Company |
|---|---|---|---|
| Leprevost Ryan M | $208,000 | -- | |
| Sullivan Daniel R | $142,500 | -- |
Source: Public Records
Mortgage History
We collect this data history from publicly available records. To have your information removed, we recommend requesting removal directly through your county’s website.
| Date | Status | Borrower | Loan Amount |
|---|---|---|---|
| Open | Leprevost Ryan M | $202,727 | |
| Previous Owner | Sullivan Daniel R | $10,000 | |
| Previous Owner | Sullivan Daniel R | $107,000 | |
| Previous Owner | Sullivan Daniel R | $5,000 | |
| Previous Owner | Sullivan Daniel R | $85,000 |
Source: Public Records
Tax History
| Year | Tax Paid | Tax Assessment Tax Assessment Total Assessment is a certain percentage of the fair market value that is determined by local assessors to be the total taxable value of land and additions on the property. | Land | Improvement |
|---|---|---|---|---|
| 2025 | $3,039 | $270,100 | $78,900 | $191,200 |
| 2024 | $3,180 | $282,900 | $77,300 | $205,600 |
| 2023 | $3,043 | $257,200 | $73,400 | $183,800 |
| 2022 | $2,718 | $199,100 | $63,700 | $135,400 |
| 2021 | $3,178 | $216,500 | $87,200 | $129,300 |
| 2020 | $2,961 | $201,700 | $81,700 | $120,000 |
| 2019 | $3,059 | $207,000 | $83,700 | $123,300 |
| 2018 | $3,012 | $205,900 | $83,700 | $122,200 |
| 2017 | $2,900 | $197,000 | $71,400 | $125,600 |
| 2016 | $2,839 | $195,000 | $69,400 | $125,600 |
| 2015 | $2,746 | $195,000 | $69,400 | $125,600 |
| 2014 | $2,714 | $191,800 | $69,400 | $122,400 |
Source: Public Records
Map
Nearby Homes
- 180 Center St
- 82 Dublin St
- 205 High St
- 160 High St
- 0 East St Unit 235893
- 155 Laurel St
- 15 Martin Ave
- 135 East St
- 25 Golden Hill Rd
- 53 Tabar Ave
- 80 S Prospect St
- 100 S Prospect St
- 880 East St Unit 14B
- 50 Mountain View Terrace
- 155 Water St Unit 5
- 2 Devon Rd
- 615 Laurel St
- 465 Chapel St
- 524 Walker St
- 555 Marble St
Your Personal Tour Guide
Ask me questions while you tour the home.