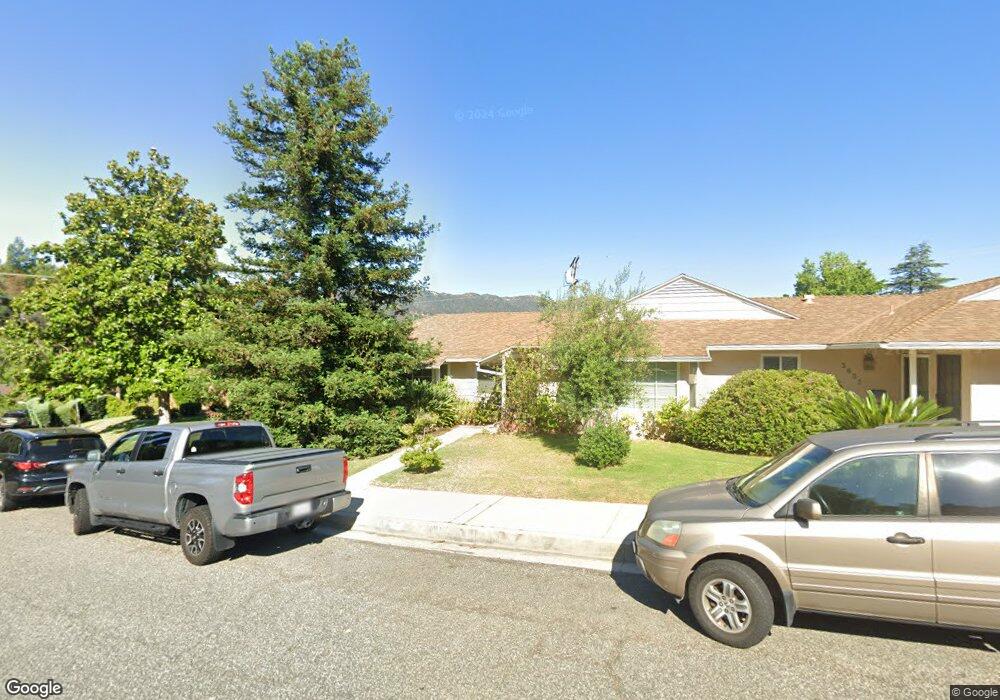
3601 Stancrest Dr Glendale, CA 91208
Montecito Park NeighborhoodEstimated Value: $1,504,000 - $1,879,883
5
Beds
3
Baths
3,164
Sq Ft
$536/Sq Ft
Est. Value
About This Home
This home is located at 3601 Stancrest Dr, Glendale, CA 91208 and is currently estimated at $1,695,471, approximately $535 per square foot. 3601 Stancrest Dr is a home located in Los Angeles County with nearby schools including John C. Fremont Elementary School, Rosemont Middle School, and Crescenta Valley High School.
Ownership History
Date
Name
Owned For
Owner Type
Purchase Details
Closed on
Jan 29, 2010
Sold by
Lee Young E
Bought by
Lee Young E
Current Estimated Value
Home Financials for this Owner
Home Financials are based on the most recent Mortgage that was taken out on this home.
Original Mortgage
$598,000
Interest Rate
5.03%
Mortgage Type
New Conventional
Purchase Details
Closed on
Feb 5, 2008
Sold by
Sisters Of Charity Of The Blessed Virgin
Bought by
Lee Young E and Lee Family Survivors Trust
Purchase Details
Closed on
Aug 24, 1999
Sold by
Goodwin John N and The Goodwin Family Trust
Bought by
Sisters Of Charity Of The Blessed Virgin
Purchase Details
Closed on
Aug 23, 1996
Sold by
Goodwin John N and Goodwin Janet S
Bought by
Goodwin John N and Goodwin Janet S
Create a Home Valuation Report for This Property
The Home Valuation Report is an in-depth analysis detailing your home's value as well as a comparison with similar homes in the area
Home Values in the Area
Average Home Value in this Area
Purchase History
| Date | Buyer | Sale Price | Title Company |
|---|---|---|---|
| Lee Young E | -- | Chicago Title Co | |
| Lee Young E | -- | Chicago Title Co | |
| Lee Young E | $1,025,000 | Orange Coast Title Company | |
| Sisters Of Charity Of The Blessed Virgin | $470,000 | Chicago Title | |
| Goodwin John N | -- | -- |
Source: Public Records
Mortgage History
| Date | Status | Borrower | Loan Amount |
|---|---|---|---|
| Closed | Lee Young E | $598,000 |
Source: Public Records
Tax History
| Year | Tax Paid | Tax Assessment Tax Assessment Total Assessment is a certain percentage of the fair market value that is determined by local assessors to be the total taxable value of land and additions on the property. | Land | Improvement |
|---|---|---|---|---|
| 2025 | $14,816 | $1,346,344 | $1,077,082 | $269,262 |
| 2024 | $14,816 | $1,319,946 | $1,055,963 | $263,983 |
| 2023 | $14,482 | $1,294,065 | $1,035,258 | $258,807 |
| 2022 | $14,233 | $1,268,692 | $1,014,959 | $253,733 |
| 2021 | $13,986 | $1,243,816 | $995,058 | $248,758 |
| 2019 | $13,455 | $1,206,926 | $965,545 | $241,381 |
| 2018 | $13,149 | $1,183,262 | $946,613 | $236,649 |
| 2016 | $12,545 | $1,137,315 | $909,855 | $227,460 |
| 2015 | $12,289 | $1,120,233 | $896,189 | $224,044 |
| 2014 | $12,189 | $1,098,290 | $878,634 | $219,656 |
Source: Public Records
Map
Nearby Homes
- 4337 Vista Place
- 3226 Menlo Dr
- 3328 N Verdugo Rd
- 3600 Buena Vista Ave
- 2123 Crescent Ave
- 4123 Ocean View Blvd
- 4422 Indiana Ave
- 4599 Hillard Ave
- 4430 Rosebank Dr
- 2217 Crescent Ave
- 3629 Sierra Vista Ave
- 3412 La Crescenta Ave
- 2950 Oak Glen Rd
- 2608 Honolulu Ave Unit 310
- 1881 Alpha Rd Unit 17
- 1935 Alpha Rd Unit 337
- 2124 Patagonia Dr
- 2940 N Verdugo Rd Unit 305
- 1621 San Gabriel Ave
- 1247 Flanders Rd
- 3603 Stancrest Dr Unit 3603
- 3609 Stancrest Dr
- 3614 Valihi Way
- 3610 Valihi Way Unit B
- 3610 Valihi Way
- 3618 Valihi Way
- 3604 Valihi Way Unit B
- 3615 Stancrest Dr
- 2316 Broadview Dr Unit 2316
- 3622 Valihi Way
- 3608 Stancrest Dr
- 3600 Stancrest Dr
- 3612 Stancrest Dr Unit B
- 3625 Stancrest Dr
- 3520 Stancrest Dr
- 3511 Stancrest Dr
- 3509 Stancrest Dr
- 3623 Stancrest Dr
- 3623 Stancrest Dr
- 3623 Stancrest Dr Unit C
Your Personal Tour Guide
Ask me questions while you tour the home.