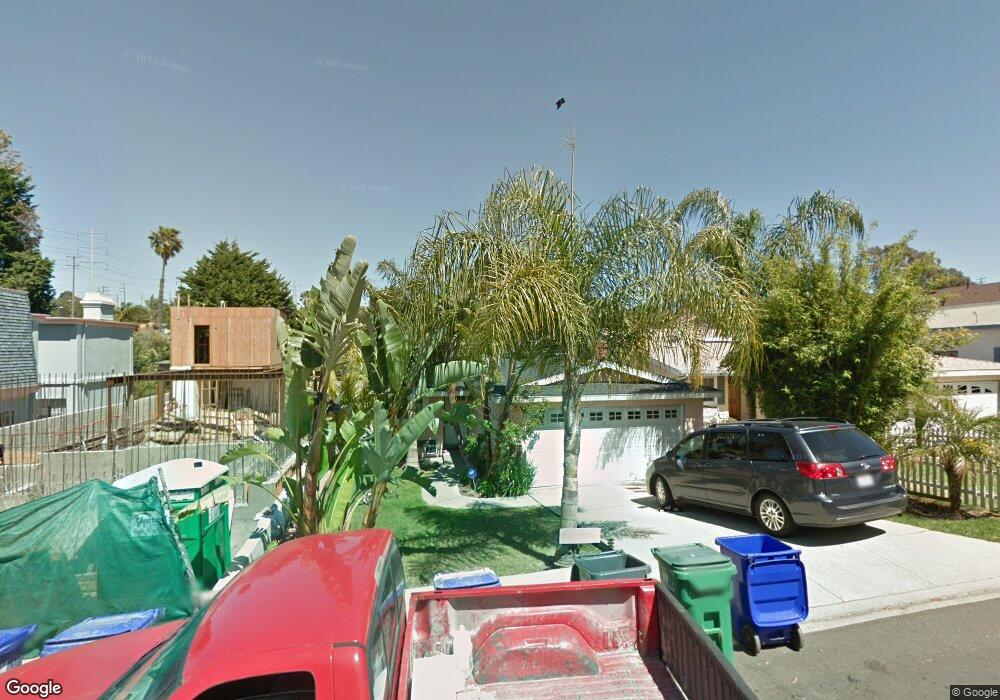
3604 Maple Ave Manhattan Beach, CA 90266
Estimated Value: $2,373,643 - $3,096,000
3
Beds
2
Baths
1,488
Sq Ft
$1,761/Sq Ft
Est. Value
About This Home
This home is located at 3604 Maple Ave, Manhattan Beach, CA 90266 and is currently estimated at $2,620,411, approximately $1,761 per square foot. 3604 Maple Ave is a home located in Los Angeles County with nearby schools including Pacific Elementary School, Manhattan Beach Middle School, and Mira Costa High School.
Ownership History
Date
Name
Owned For
Owner Type
Purchase Details
Closed on
Aug 18, 2000
Sold by
Clow Dolous M
Bought by
Estes Ronald W and Ritterman Estes Audrey L
Current Estimated Value
Home Financials for this Owner
Home Financials are based on the most recent Mortgage that was taken out on this home.
Original Mortgage
$375,000
Outstanding Balance
$130,205
Interest Rate
7.62%
Estimated Equity
$2,490,206
Create a Home Valuation Report for This Property
The Home Valuation Report is an in-depth analysis detailing your home's value as well as a comparison with similar homes in the area
Home Values in the Area
Average Home Value in this Area
Purchase History
| Date | Buyer | Sale Price | Title Company |
|---|---|---|---|
| Estes Ronald W | $500,000 | Investors Title Company |
Source: Public Records
Mortgage History
| Date | Status | Borrower | Loan Amount |
|---|---|---|---|
| Open | Estes Ronald W | $375,000 |
Source: Public Records
Tax History
| Year | Tax Paid | Tax Assessment Tax Assessment Total Assessment is a certain percentage of the fair market value that is determined by local assessors to be the total taxable value of land and additions on the property. | Land | Improvement |
|---|---|---|---|---|
| 2025 | $10,419 | $904,086 | $678,071 | $226,015 |
| 2024 | $10,419 | $886,360 | $664,776 | $221,584 |
| 2023 | $10,121 | $868,982 | $651,742 | $217,240 |
| 2022 | $9,950 | $851,944 | $638,963 | $212,981 |
| 2021 | $9,817 | $835,240 | $626,435 | $208,805 |
| 2019 | $9,558 | $810,467 | $607,855 | $202,612 |
| 2018 | $9,349 | $794,577 | $595,937 | $198,640 |
| 2016 | $8,568 | $763,725 | $572,797 | $190,928 |
| 2015 | $8,391 | $752,255 | $564,194 | $188,061 |
| 2014 | $8,280 | $737,521 | $553,143 | $184,378 |
Source: Public Records
Map
Nearby Homes
Your Personal Tour Guide
Ask me questions while you tour the home.