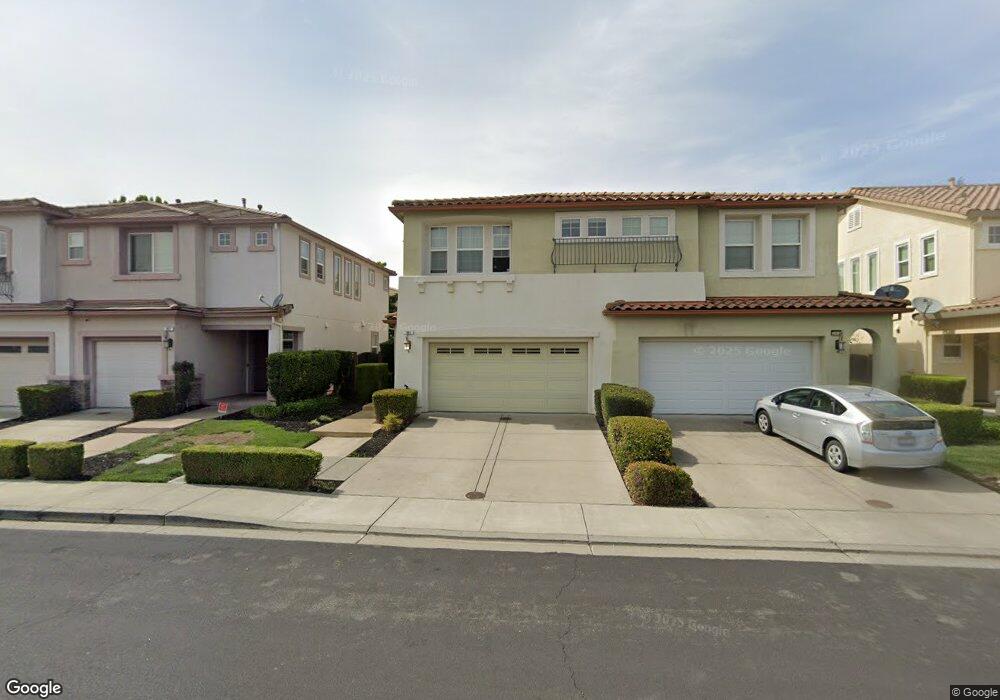
361 Gabiano Ct Vacaville, CA 95687
Estimated Value: $494,000 - $510,000
3
Beds
3
Baths
1,229
Sq Ft
$410/Sq Ft
Est. Value
About This Home
This home is located at 361 Gabiano Ct, Vacaville, CA 95687 and is currently estimated at $504,485, approximately $410 per square foot. 361 Gabiano Ct is a home located in Solano County with nearby schools including Eugene Padan Elementary School, Orchard Elementary School, and Vaca Pena Middle School.
Ownership History
Date
Name
Owned For
Owner Type
Purchase Details
Closed on
Jul 13, 2016
Sold by
Cam Ix Trust
Bought by
Galyen Jamie
Current Estimated Value
Home Financials for this Owner
Home Financials are based on the most recent Mortgage that was taken out on this home.
Original Mortgage
$319,113
Outstanding Balance
$256,135
Interest Rate
3.75%
Mortgage Type
FHA
Estimated Equity
$248,350
Purchase Details
Closed on
Feb 13, 2016
Sold by
Becklo Nathan and Becklo Denise
Bought by
Cam Ix Trust
Purchase Details
Closed on
Sep 22, 2009
Sold by
Standard Pacific Corp
Bought by
Becklo Nathan and Becklo Denise
Home Financials for this Owner
Home Financials are based on the most recent Mortgage that was taken out on this home.
Original Mortgage
$247,913
Interest Rate
5.14%
Mortgage Type
FHA
Create a Home Valuation Report for This Property
The Home Valuation Report is an in-depth analysis detailing your home's value as well as a comparison with similar homes in the area
Home Values in the Area
Average Home Value in this Area
Purchase History
| Date | Buyer | Sale Price | Title Company |
|---|---|---|---|
| Galyen Jamie | $327,000 | Fidelity National Title Co | |
| Cam Ix Trust | $245,060 | None Available | |
| Becklo Nathan | $252,500 | Old Republic Title Co |
Source: Public Records
Mortgage History
| Date | Status | Borrower | Loan Amount |
|---|---|---|---|
| Open | Galyen Jamie | $319,113 | |
| Previous Owner | Becklo Nathan | $247,913 |
Source: Public Records
Tax History Compared to Growth
Tax History
| Year | Tax Paid | Tax Assessment Tax Assessment Total Assessment is a certain percentage of the fair market value that is determined by local assessors to be the total taxable value of land and additions on the property. | Land | Improvement |
|---|---|---|---|---|
| 2025 | $5,281 | $379,504 | $87,041 | $292,463 |
| 2024 | $5,281 | $372,064 | $85,335 | $286,729 |
| 2023 | $5,102 | $364,769 | $83,662 | $281,107 |
| 2022 | $4,991 | $357,618 | $82,022 | $275,596 |
| 2021 | $4,944 | $350,607 | $80,414 | $270,193 |
| 2020 | $4,857 | $347,013 | $79,590 | $267,423 |
| 2019 | $4,779 | $340,210 | $78,030 | $262,180 |
| 2018 | $4,720 | $333,540 | $76,500 | $257,040 |
| 2017 | $4,562 | $327,000 | $75,000 | $252,000 |
| 2016 | $3,972 | $275,327 | $65,424 | $209,903 |
| 2015 | $3,907 | $271,193 | $64,442 | $206,751 |
| 2014 | $3,484 | $248,000 | $57,000 | $191,000 |
Source: Public Records
Map
Nearby Homes
- 325 Gabiano Ct
- 491 Rosso Ct
- 1079 Portofino Ave
- 731 La Cruz Ln
- 325 Marshall Rd
- 632 Cordelia Cir
- 1217 Alderwood Way
- 1221 Devonshire Dr
- 149 Fairoaks Dr
- 1121 Creekside Dr
- 1200 Terrace Ct
- 678 Claremont Dr
- 1057 Davis St
- 1173 Araquipa Ct
- 970 El Camino Ave Unit 3
- 1199 Creekside Dr
- 680 S Orchard Ave
- 814 Kingman Dr
- 569 Alamo Dr
- 0 Merchant St Unit 325089259