Estimated Value: $585,000 - $614,393
4
Beds
2
Baths
1,252
Sq Ft
$479/Sq Ft
Est. Value
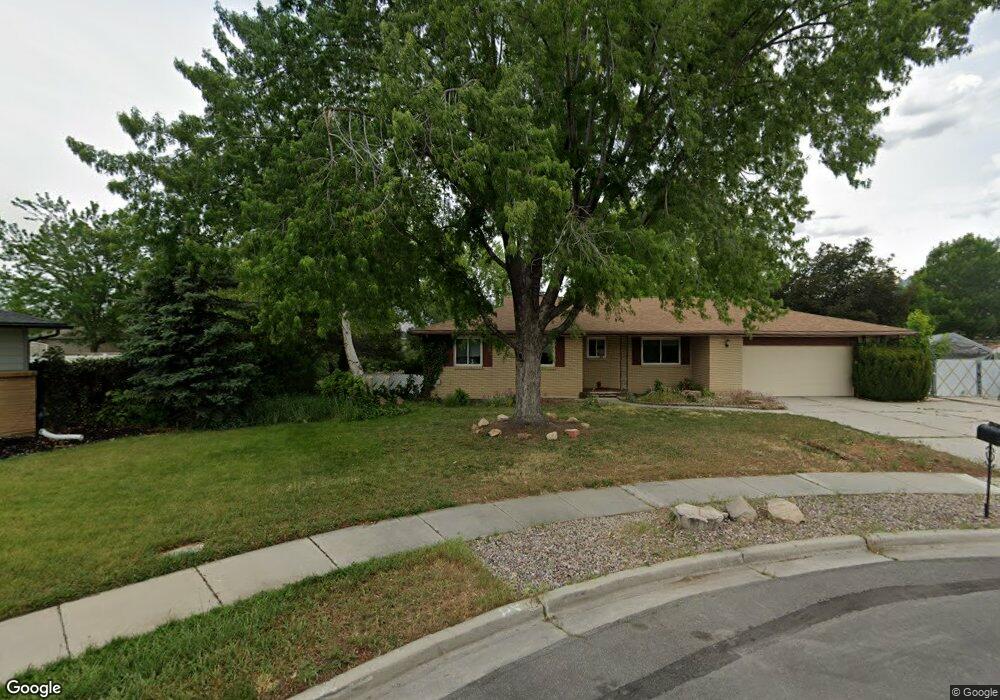
About This Home
This home is located at 361 James Cir, Sandy, UT 84070 and is currently estimated at $599,848, approximately $479 per square foot. 361 James Cir is a home located in Salt Lake County with nearby schools including Mount Jordan Middle School and Jordan High.
Ownership History
Date
Name
Owned For
Owner Type
Purchase Details
Closed on
Jan 24, 2021
Sold by
Femenias Thor F
Bought by
Femenias Thor Frederik
Current Estimated Value
Home Financials for this Owner
Home Financials are based on the most recent Mortgage that was taken out on this home.
Original Mortgage
$167,000
Outstanding Balance
$149,286
Interest Rate
2.67%
Mortgage Type
New Conventional
Estimated Equity
$450,562
Purchase Details
Closed on
Nov 18, 2014
Sold by
Sanders Family Properties Lc
Bought by
Femenias Thor F
Home Financials for this Owner
Home Financials are based on the most recent Mortgage that was taken out on this home.
Original Mortgage
$196,960
Interest Rate
4.1%
Mortgage Type
New Conventional
Purchase Details
Closed on
Apr 26, 1999
Sold by
Sanders Melvin M and Sanders Fae T
Bought by
Sanders Family Properties Lc
Purchase Details
Closed on
Jul 26, 1995
Sold by
Sanders Melvin M and Sanders Fae T
Bought by
Sanders Melvin M and Sanders Fae T
Create a Home Valuation Report for This Property
The Home Valuation Report is an in-depth analysis detailing your home's value as well as a comparison with similar homes in the area
Home Values in the Area
Average Home Value in this Area
Purchase History
| Date | Buyer | Sale Price | Title Company |
|---|---|---|---|
| Femenias Thor Frederik | -- | First American Title | |
| Femenias Thor F | -- | Metro National Title | |
| Sanders Family Properties Lc | -- | -- | |
| Sanders Melvin M | -- | -- |
Source: Public Records
Mortgage History
| Date | Status | Borrower | Loan Amount |
|---|---|---|---|
| Open | Femenias Thor Frederik | $167,000 | |
| Closed | Femenias Thor F | $196,960 |
Source: Public Records
Tax History
| Year | Tax Paid | Tax Assessment Tax Assessment Total Assessment is a certain percentage of the fair market value that is determined by local assessors to be the total taxable value of land and additions on the property. | Land | Improvement |
|---|---|---|---|---|
| 2025 | $3,301 | $628,100 | $208,800 | $419,300 |
| 2024 | $3,301 | $610,500 | $203,100 | $407,400 |
| 2023 | $2,771 | $511,000 | $190,800 | $320,200 |
| 2022 | $2,903 | $522,900 | $123,000 | $399,900 |
| 2021 | $2,613 | $400,700 | $94,300 | $306,400 |
| 2020 | $2,493 | $360,500 | $94,300 | $266,200 |
| 2019 | $2,437 | $343,400 | $89,000 | $254,400 |
| 2016 | $1,937 | $262,400 | $89,000 | $173,400 |
Source: Public Records
Map
Nearby Homes
- 186 Brent Cir
- 487 E 9270 S
- 566 E 9270 S
- 362 E 9150 S
- 9822 S Darin Dr
- 181 E 9180 S
- 37 Crawford Place
- 9218 S Laura Anne Way
- 807 E Whisper Cove Rd
- 8750 S 500 E
- 8812 S Cy's Park Ln Unit 6
- 8807 S Cy's Park Ln E Unit 1
- 8806 S Cy's Park Ln E Unit 4
- 8808 S Cy's Park Unit 5
- 9420 S Streatham Rd
- 9092 Enchanted Oak Ln
- 165 Albion Village Way Unit 303
- 9101 S Enchanted Oak Ln
- 170 Albion Village Way Unit 202
- 8475 S State St
Your Personal Tour Guide
Ask me questions while you tour the home.