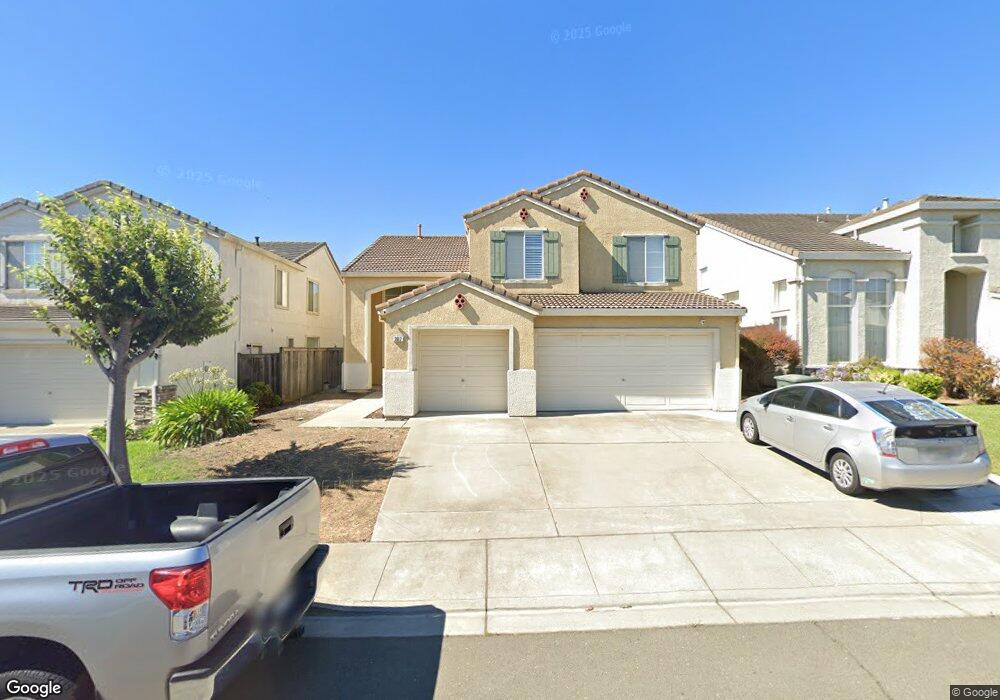
3617 Rocky Shore Dr Vallejo, CA 94591
Northgate NeighborhoodEstimated Value: $728,146 - $804,000
5
Beds
3
Baths
2,455
Sq Ft
$311/Sq Ft
Est. Value
About This Home
This home is located at 3617 Rocky Shore Dr, Vallejo, CA 94591 and is currently estimated at $763,287, approximately $310 per square foot. 3617 Rocky Shore Dr is a home located in Solano County with nearby schools including Joseph H. Wardlaw Elementary School, Hogan Middle School, and Jesse M. Bethel High School.
Ownership History
Date
Name
Owned For
Owner Type
Purchase Details
Closed on
Mar 17, 2015
Sold by
Deguzman Rachel Salumbides and De Guzman Joseph Mark
Bought by
Deguzman Joseph Mark and Salumbides Deguzman Rachel A
Current Estimated Value
Home Financials for this Owner
Home Financials are based on the most recent Mortgage that was taken out on this home.
Original Mortgage
$353,600
Outstanding Balance
$271,022
Interest Rate
3.7%
Mortgage Type
New Conventional
Estimated Equity
$492,265
Purchase Details
Closed on
Jul 16, 2007
Sold by
Salumbides Rafael and Salumbides Aida
Bought by
Salumbides Deguzman Rachel and Deguzman Joseph Mark
Purchase Details
Closed on
Dec 19, 1997
Sold by
Campobello Development Corp
Bought by
Salumbides Rafael and Salumbides Aida
Home Financials for this Owner
Home Financials are based on the most recent Mortgage that was taken out on this home.
Original Mortgage
$208,000
Interest Rate
7.22%
Create a Home Valuation Report for This Property
The Home Valuation Report is an in-depth analysis detailing your home's value as well as a comparison with similar homes in the area
Home Values in the Area
Average Home Value in this Area
Purchase History
| Date | Buyer | Sale Price | Title Company |
|---|---|---|---|
| Deguzman Joseph Mark | -- | First American Title | |
| Salumbides Deguzman Rachel | $192,000 | None Available | |
| Salumbides Rafael | $260,000 | First American Title Guarant |
Source: Public Records
Mortgage History
| Date | Status | Borrower | Loan Amount |
|---|---|---|---|
| Open | Deguzman Joseph Mark | $353,600 | |
| Previous Owner | Salumbides Rafael | $208,000 | |
| Closed | Salumbides Rafael | $26,000 |
Source: Public Records
Tax History Compared to Growth
Tax History
| Year | Tax Paid | Tax Assessment Tax Assessment Total Assessment is a certain percentage of the fair market value that is determined by local assessors to be the total taxable value of land and additions on the property. | Land | Improvement |
|---|---|---|---|---|
| 2025 | $7,170 | $423,518 | $103,782 | $319,736 |
| 2024 | $7,170 | $415,215 | $101,748 | $313,467 |
| 2023 | $6,862 | $407,074 | $99,753 | $307,321 |
| 2022 | $6,777 | $399,094 | $97,799 | $301,295 |
| 2021 | $6,658 | $391,270 | $95,882 | $295,388 |
| 2020 | $6,694 | $387,259 | $94,899 | $292,360 |
| 2019 | $6,546 | $379,667 | $93,039 | $286,628 |
| 2018 | $6,225 | $372,223 | $91,215 | $281,008 |
| 2017 | $6,014 | $364,926 | $89,427 | $275,499 |
| 2016 | $5,445 | $357,772 | $87,674 | $270,098 |
| 2015 | $5,391 | $352,399 | $86,358 | $266,041 |
| 2014 | $5,327 | $345,497 | $84,667 | $260,830 |
Source: Public Records
Map
Nearby Homes
- 2011 Agate Ct
- 6206 Pebble Beach Dr
- 2139 Garnet Cir
- 3554 Calm Breeze Ct
- 367 Darley Dr
- 7809 Caracena Ct
- 1132 Waltz Ct
- 1146 Waltz Ct
- 1233 Symphony Way
- 6857 Sunriver Ln
- 559 Topley Ct
- 9216 Hallmark Place
- 400 Foothill Dr
- 6320 Pebble Beach Dr
- 131 Sheila Ct
- 100 Percheron Ct
- 272 Woodridge Dr
- 2890 Redwood Pkwy Unit 61
- 121 Kim Ct
- 225 Skyline Dr
- 3609 Rocky Shore Dr
- 3621 Rocky Shore Dr
- 3625 Rocky Shore Dr
- 3605 Rocky Shore Dr
- 3404 Edgewater Place
- 3406 Edgewater Place
- 3157 Terrace Beach Dr
- 3402 Edgewater Place
- 3408 Edgewater Place
- 3629 Rocky Shore Dr
- 3601 Rocky Shore Dr
- 3618 Rocky Shore Dr
- 3624 Rocky Shore Dr
- 3410 Edgewater Place
- 3612 Rocky Shore Dr
- 3400 Edgewater Place
- 3606 Rocky Shore Dr
- 3630 Rocky Shore Dr
- 3633 Rocky Shore Dr
- 3412 Edgewater Place