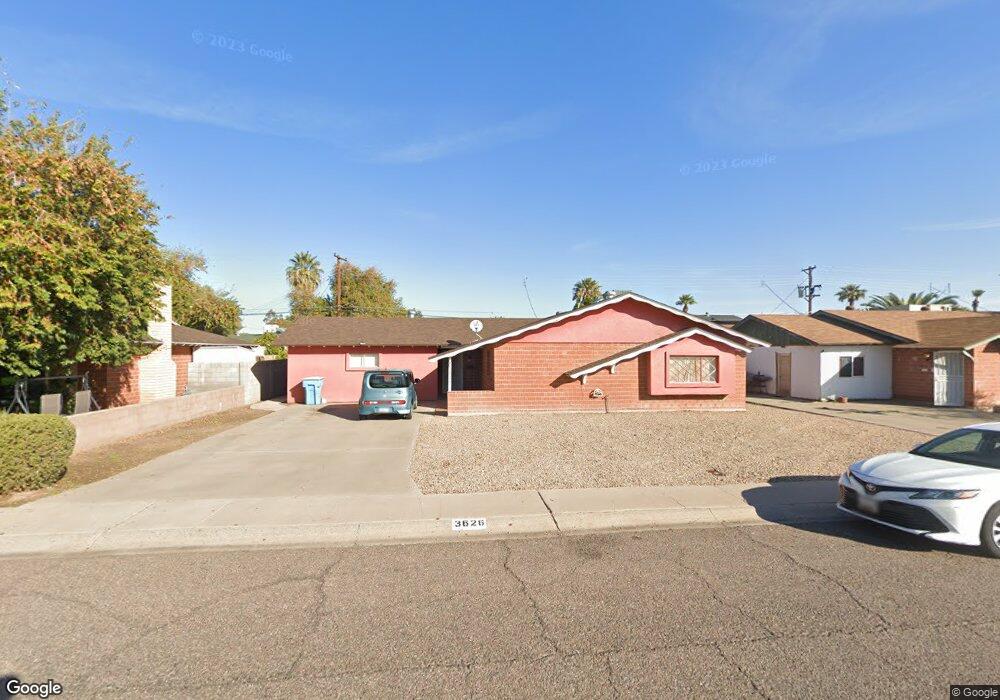
3626 W Krall St Phoenix, AZ 85019
Alhambra NeighborhoodEstimated Value: $302,442 - $393,000
3
Beds
2
Baths
1,836
Sq Ft
$190/Sq Ft
Est. Value
About This Home
This home is located at 3626 W Krall St, Phoenix, AZ 85019 and is currently estimated at $349,611, approximately $190 per square foot. 3626 W Krall St is a home located in Maricopa County with nearby schools including Catalina Ventura School, Alhambra High School, and Phoenix Coding Academy.
Ownership History
Date
Name
Owned For
Owner Type
Purchase Details
Closed on
Jun 29, 2011
Sold by
U S Bank Na
Bought by
Le Minh Tien and Le Tammy Dan
Current Estimated Value
Purchase Details
Closed on
Apr 28, 2011
Sold by
Martinez Felipe C
Bought by
U S Bank Na
Purchase Details
Closed on
Feb 13, 2007
Sold by
Jimenez Yari Martinez
Bought by
Garcia Melquiades Ocampo
Purchase Details
Closed on
Feb 21, 2006
Sold by
Martinez Ernestina
Bought by
Martinez Felipe C
Home Financials for this Owner
Home Financials are based on the most recent Mortgage that was taken out on this home.
Original Mortgage
$43,800
Interest Rate
6.08%
Mortgage Type
Stand Alone Second
Purchase Details
Closed on
Jun 24, 2005
Sold by
Luplow Mable Sue
Bought by
Brosemann Robert A and Brosemann Sharon L
Purchase Details
Closed on
Aug 29, 1967
Sold by
Grossmann Roy Edward and Grossmann Irene Charlotte
Bought by
Coie Sue E and Ludlow Mable
Create a Home Valuation Report for This Property
The Home Valuation Report is an in-depth analysis detailing your home's value as well as a comparison with similar homes in the area
Home Values in the Area
Average Home Value in this Area
Purchase History
| Date | Buyer | Sale Price | Title Company |
|---|---|---|---|
| Le Minh Tien | $45,050 | North American Title Company | |
| U S Bank Na | $197,321 | None Available | |
| Garcia Melquiades Ocampo | -- | None Available | |
| Garcia Melquiades Ocampo | -- | None Available | |
| Martinez Felipe C | -- | Equity Title Agency Inc | |
| Martinez Felipe C | $219,000 | Equity Title Agency Inc | |
| Brosemann Robert A | $150,000 | Equity Title Agency Inc | |
| Coie Sue E | -- | Stewart Title & Trust |
Source: Public Records
Mortgage History
| Date | Status | Borrower | Loan Amount |
|---|---|---|---|
| Previous Owner | Martinez Felipe C | $43,800 | |
| Previous Owner | Martinez Felipe C | $175,200 |
Source: Public Records
Tax History Compared to Growth
Tax History
| Year | Tax Paid | Tax Assessment Tax Assessment Total Assessment is a certain percentage of the fair market value that is determined by local assessors to be the total taxable value of land and additions on the property. | Land | Improvement |
|---|---|---|---|---|
| 2025 | $1,997 | $12,632 | -- | -- |
| 2024 | $1,823 | $12,031 | -- | -- |
| 2023 | $1,823 | $25,120 | $5,020 | $20,100 |
| 2022 | $1,795 | $19,870 | $3,970 | $15,900 |
| 2021 | $1,812 | $17,070 | $3,410 | $13,660 |
| 2020 | $1,742 | $16,120 | $3,220 | $12,900 |
| 2019 | $1,721 | $14,400 | $2,880 | $11,520 |
| 2018 | $1,589 | $13,280 | $2,650 | $10,630 |
| 2017 | $1,568 | $11,400 | $2,280 | $9,120 |
| 2016 | $998 | $9,210 | $1,840 | $7,370 |
| 2015 | $944 | $7,700 | $1,540 | $6,160 |
Source: Public Records
Map
Nearby Homes
- 3632 W Mclellan Blvd
- 3620 W Sierra Vista Dr
- 3538 W Sierra Vista Dr
- 3730 W Tuckey Ln
- 3446 W Mclellan Blvd
- 6818 N 35th Ave Unit I
- 3513 W Maryland Ave
- 6334 N 37th Ave
- 3842 W Ocotillo Rd
- 3420 W Maryland Ave
- 7101 N 36th Ave Unit 102
- 3648 W Rose Ln
- 6212 N 34th Dr
- 3647 W Rose Ln
- 3426 W Glenn Dr
- 3226 W Maryland Ave
- 7017 N 33rd Ave
- 3228 W Glendale Ave Unit 103
- 3228 W Glendale Ave Unit 170
- 3228 W Glendale Ave Unit 161
- 3620 W Krall St
- 3632 W Krall St
- 3625 W Ocotillo Rd
- 3619 W Ocotillo Rd
- 3631 W Ocotillo Rd
- 3638 W Krall St
- 3625 W Krall St
- 3631 W Krall St
- 3619 W Krall St
- 3613 W Ocotillo Rd
- 3637 W Ocotillo Rd
- 3613 W Krall St
- 3637 W Krall St
- 3608 W Krall St
- 3644 W Krall St
- 3607 W Ocotillo Rd
- 3643 W Ocotillo Rd
- 3607 W Krall St
- 3643 W Krall St
- 3626 W Tuckey Ln