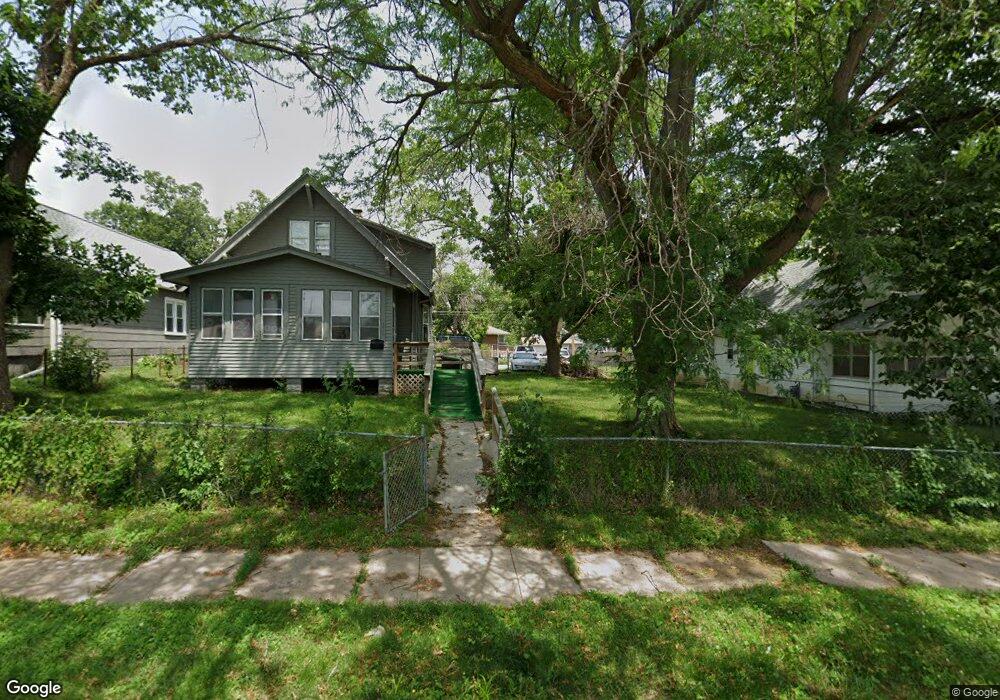
3640 Polk St Omaha, NE 68107
South Central Omaha NeighborhoodEstimated Value: $170,088 - $226,000
4
Beds
2
Baths
1,247
Sq Ft
$161/Sq Ft
Est. Value
About This Home
This home is located at 3640 Polk St, Omaha, NE 68107 and is currently estimated at $201,022, approximately $161 per square foot. 3640 Polk St is a home located in Douglas County with nearby schools including Gilder Elementary School, Bryan Middle School, and Bryan High School.
Ownership History
Date
Name
Owned For
Owner Type
Purchase Details
Closed on
Sep 13, 2022
Sold by
Tito Flores
Bought by
Flores Ii Llc
Current Estimated Value
Purchase Details
Closed on
Sep 28, 2011
Sold by
Federal National Mortgage Association
Bought by
Flores Tito
Purchase Details
Closed on
Jan 21, 2011
Sold by
Valadez Ramiro T and Valadez Angela
Bought by
Fannie Mae
Purchase Details
Closed on
Jul 1, 2002
Sold by
Btr Properties Llc
Bought by
Valadez Ramiro T and Valadez Angela
Home Financials for this Owner
Home Financials are based on the most recent Mortgage that was taken out on this home.
Original Mortgage
$75,050
Interest Rate
6.48%
Create a Home Valuation Report for This Property
The Home Valuation Report is an in-depth analysis detailing your home's value as well as a comparison with similar homes in the area
Home Values in the Area
Average Home Value in this Area
Purchase History
| Date | Buyer | Sale Price | Title Company |
|---|---|---|---|
| Flores Ii Llc | -- | -- | |
| Flores Tito | -- | Dodge Title & Escrow Co Llc | |
| Fannie Mae | $57,142 | None Available | |
| Valadez Ramiro T | $79,000 | -- |
Source: Public Records
Mortgage History
| Date | Status | Borrower | Loan Amount |
|---|---|---|---|
| Previous Owner | Valadez Ramiro T | $75,050 |
Source: Public Records
Tax History Compared to Growth
Tax History
| Year | Tax Paid | Tax Assessment Tax Assessment Total Assessment is a certain percentage of the fair market value that is determined by local assessors to be the total taxable value of land and additions on the property. | Land | Improvement |
|---|---|---|---|---|
| 2024 | $2,087 | $99,900 | $14,500 | $85,400 |
| 2023 | $2,087 | $98,900 | $14,500 | $84,400 |
| 2022 | $1,930 | $90,400 | $6,000 | $84,400 |
| 2021 | $1,642 | $77,600 | $6,000 | $71,600 |
| 2020 | $1,661 | $77,600 | $6,000 | $71,600 |
| 2019 | $1,621 | $75,500 | $6,000 | $69,500 |
| 2018 | $1,705 | $79,300 | $6,000 | $73,300 |
| 2017 | $1,714 | $79,300 | $6,000 | $73,300 |
| 2016 | $1,702 | $79,300 | $6,000 | $73,300 |
| 2015 | $1,679 | $79,300 | $6,000 | $73,300 |
| 2014 | $1,679 | $79,300 | $6,000 | $73,300 |
Source: Public Records
Map
Nearby Homes