
Seller's Agent in 2026
Steve O'Brien
RE/MAX
(775) 233-4403
25 in this area
451 Total Sales
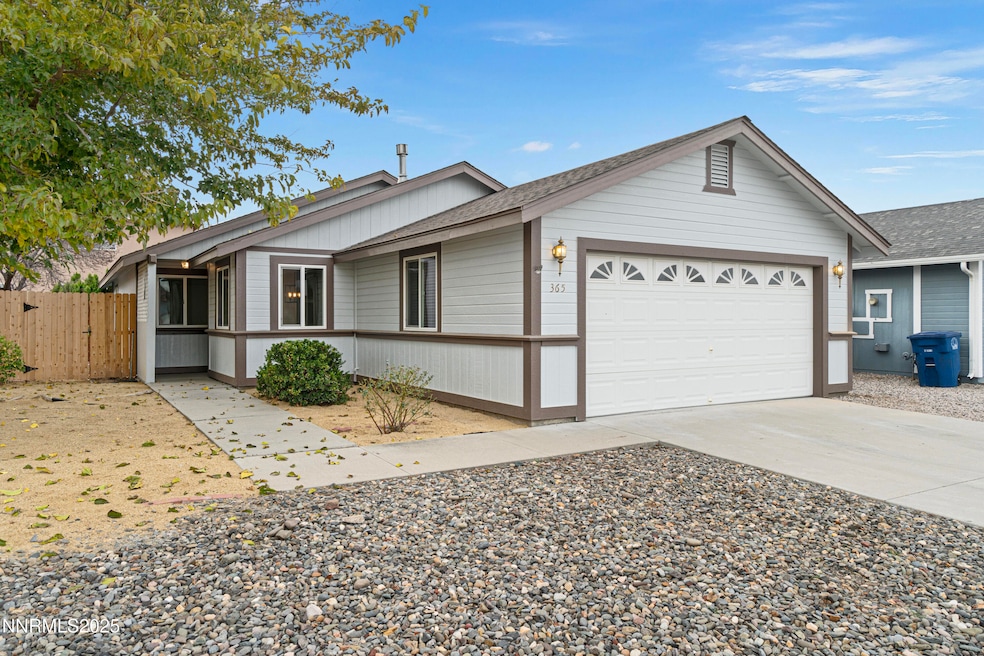
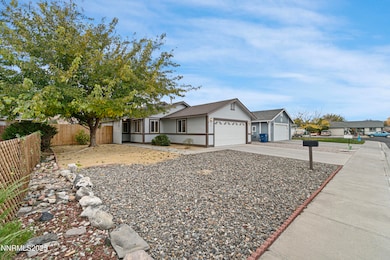
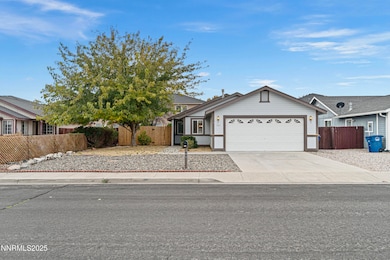
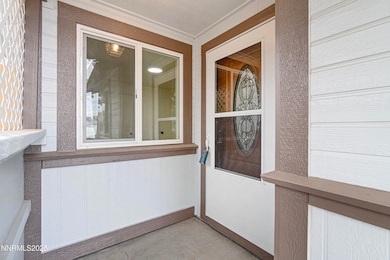
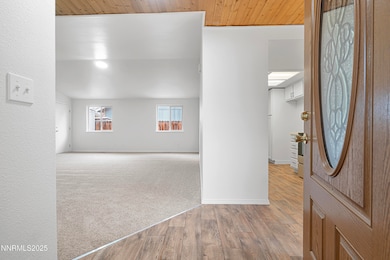
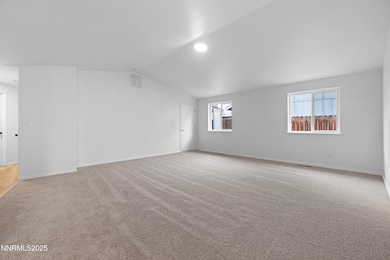
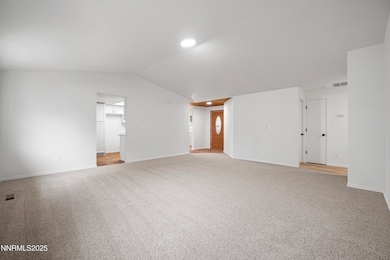
Move-In Ready home in Fallon featuring 3 bedrooms, 2 bathrooms and a 2 car garage.
Last Agent to Sell the Property
RE/MAX Professionals-Reno License #BS.1000912 Listed on: 11/18/2025
| Date | Type | Sale Price | Title Company |
|---|---|---|---|
| Bargain Sale Deed | $350,000 | Stewart Title Company | |
| Bargain Sale Deed | $280,000 | Stewart Title Company | |
| Interfamily Deed Transfer | -- | None Available | |
| Grant Deed | $75,000 | Ticor Title Of Nevada Inc | |
| Trustee Deed | $105,000 | Accommodation | |
| Bargain Sale Deed | $171,750 | Western Nevada Title Co |
| Date | Status | Loan Amount | Loan Type |
|---|---|---|---|
| Open | $350,000 | VA | |
| Previous Owner | $75,000 | VA | |
| Previous Owner | $137,400 | New Conventional |
| Date | Event | Price | List to Sale | Price per Sq Ft | Prior Sale |
|---|---|---|---|---|---|
| 02/18/2026 02/18/26 | Sold | $350,000 | +3.0% | $251 / Sq Ft | |
| 11/18/2025 11/18/25 | For Sale | $339,900 | +21.4% | $244 / Sq Ft | |
| 09/26/2025 09/26/25 | Sold | $280,000 | -13.8% | $201 / Sq Ft | View Prior Sale |
| 09/09/2025 09/09/25 | Price Changed | $324,900 | -3.0% | $233 / Sq Ft | |
| 08/08/2025 08/08/25 | For Sale | $335,000 | -- | $241 / Sq Ft |
| Year | Tax Paid | Tax Assessment Tax Assessment Total Assessment is a certain percentage of the fair market value that is determined by local assessors to be the total taxable value of land and additions on the property. | Land | Improvement |
|---|---|---|---|---|
| 2025 | $404 | $71,520 | $21,700 | $49,820 |
| 2024 | $404 | $70,336 | $19,950 | $50,386 |
| 2023 | $404 | $67,403 | $19,950 | $47,453 |
| 2022 | $443 | $53,525 | $11,900 | $41,625 |
| 2021 | $1,512 | $49,143 | $11,900 | $37,243 |
| 2020 | $1,464 | $46,773 | $11,900 | $34,873 |
| 2019 | $1,421 | $46,047 | $11,900 | $34,147 |
| 2018 | $1,380 | $45,303 | $11,900 | $33,403 |
| 2017 | $1,339 | $44,038 | $10,500 | $33,538 |
| 2016 | $1,305 | $38,732 | $7,875 | $30,857 |
| 2015 | $1,280 | $35,353 | $7,875 | $27,478 |
| 2014 | $1,248 | $32,990 | $7,875 | $25,115 |
Seller's Agent in 2026
Steve O'Brien
RE/MAX
(775) 233-4403
25 in this area
451 Total Sales
Buyer's Agent in 2026
Emma Johnson
Berney Realty, LTD
(775) 217-9538
65 in this area
181 Total Sales
Seller's Agent in 2025
Daniel McCreary
RE/MAX
(775) 745-9106
3 in this area
74 Total Sales
Source: Northern Nevada Regional MLS
MLS Number: 250058333
APN: 001-036-08
Disclaimer: Certain information contained herein is derived from information provided by parties other than Homes.com. All information provided is deemed reliable, but is not guaranteed to be accurate and should be independently verified.
![]() IDX information is provided exclusively for personal, non-commercial use, and may not be used for any purpose other than to identify prospective properties consumers may be interested in purchasing. Information is deemed reliable but not guaranteed. The content relating to real estate for sale on this web site comes in part from the Broker Reciprocity/ IDX program of the Northern Nevada Regional Multiple Listing Service°. Real estate listings held by brokerage firms other than Ten-X are marked with the Broker Reciprocity logo and detailed information about those listings includes the name of the listing brokerage. Any use of the content other than by a search performed by a consumer looking to purchase or rent real estate is prohibited. © 2026 Northern Nevada Regional Multiple Listing Service® MLS. All rights reserved.
IDX information is provided exclusively for personal, non-commercial use, and may not be used for any purpose other than to identify prospective properties consumers may be interested in purchasing. Information is deemed reliable but not guaranteed. The content relating to real estate for sale on this web site comes in part from the Broker Reciprocity/ IDX program of the Northern Nevada Regional Multiple Listing Service°. Real estate listings held by brokerage firms other than Ten-X are marked with the Broker Reciprocity logo and detailed information about those listings includes the name of the listing brokerage. Any use of the content other than by a search performed by a consumer looking to purchase or rent real estate is prohibited. © 2026 Northern Nevada Regional Multiple Listing Service® MLS. All rights reserved.
Ask me questions while you tour the home.