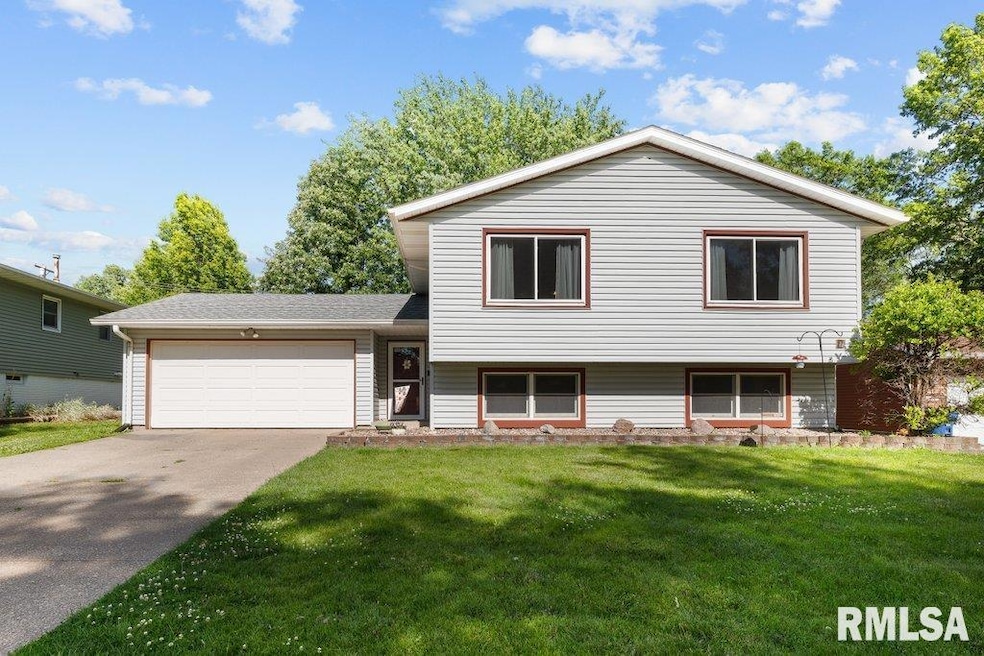
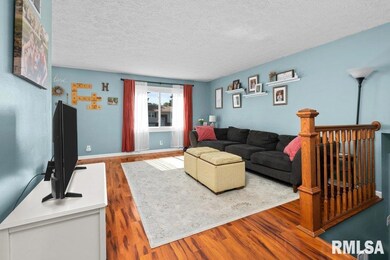
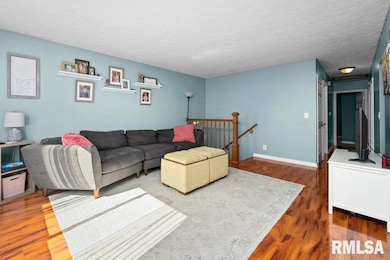
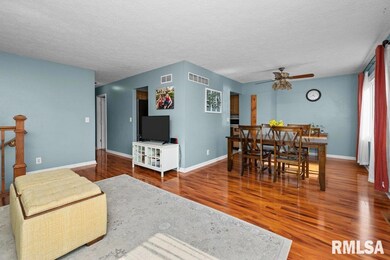
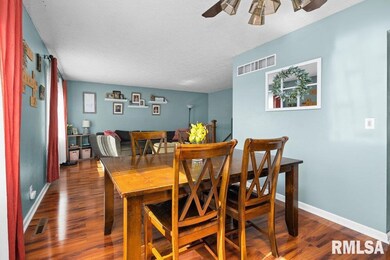
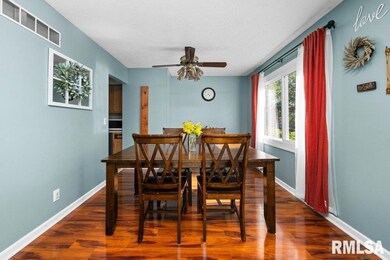
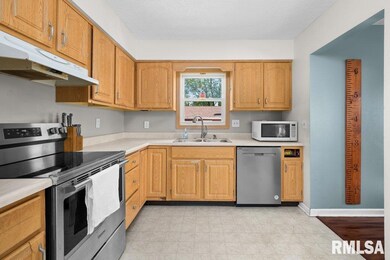
Welcome home to this 3 bed, 2.5 bath split foyer close to Hoover Elementary in Bettendorf! You'll enjoy two living spaces, one with a beautiful hearth, mantel and built-ins around a woodburning fireplace sure to feel warm and cozy in the winter. The upper level living room and dining room have nice windows that let in tons of natural light. The eat-in kitchen features newer appliances. The master bedroom has a private bathroom with a tiled shower. You can relax on the patio in the back yard while enjoying the mature trees and fenced in yard. Other updates include the electrical panel and water heater (2016), and the roof (2020). Sellers are offering a 1 year AHS Home Warranty and a $5,000 allowance for cabinets/carpet. This house is move-in ready, and waiting for its new owner to make it theirs!
Heating: Natural Gas, Forced Air, Gas Water Heater
Water Source: Public Sewer, Public
NumberOfGarageRemotes: 0
UtilitiesOnYN: Yes
Condo/Co-op/Association
Senior Community: No
Schools
High School: Bettendorf
Lot Info
Lot Size Acres: 0.21
Lot Size: 65X139
Parcel #: 841635103
ZonedAgricultural: No
Tax Info
Tax Year: 2023
Tax Annual Amount: 3468
TaxExemptions: VA Benefits
Map
Range of Values:
Collateral Analytics
Collateral Analytics
Collateral Analytics AVMs (Automated Valuation Model) employ a number of statistical approaches combined with neighborhood-specific comparable selection guarantees the most up-to-date and precise valuations.
Not Available
Collateral Analytics does not have data for the current month. Please view the chart for historical values.
ICE
ICE Mortgage Technology
ICE Mortgage Technology’s AVM (Automated Valuation Model) is a state-of-the-art online residential property valuation tool that provides a quick and accurate estimate of the value of almost any home in the U.S.
Not Available
ICE Mortgage Technology does not have data for the current month. Please view the chart for historical values.
First American
First American
First American Data & Analytics’ next-generation AVM combines unrivaled data assets with a blended ensemble of valuation models to produce highly accurate, reliable valuations you can trust.
Not Available
First American does not have data for the current month. Please view the chart for historical values.
Quantarium
Quantarium
Quantarium’s valuation service, repeatedly proven the industry’s most accurate and comprehensive, is supercharged with a self-learning and auto-tuning AI engine that continually becomes smarter and more accurate as it processes daily inputs from the industry’s leading RE data lake.
Not Available
Quantarium does not have data for the current month. Please view the chart for historical values.
Average Value
Not Available
List Price
Sold Price
Create a Home Valuation Report for This Property
The Home Valuation Report is an in-depth analysis detailing your home's value as well as a comparison with similar homes in the area
Home Values in the Area
Source: Public Records
Average Home Value in this Area
Source: Public Records
Tax History
Year
Tax Paid
Tax AssessmentTax Assessment
Total Assessment is a certain percentage of the fair market value that is determined by local assessors to be the total taxable value of land and additions on the property.
Welcome home! Great centrally located Bettendorf ranch with over 1629 finished square feet that is all new just for you! Surrounded by a wooded park like setting on a quiet cul de sac. Private backyard backing up to a wooded scene. Main level has a beautiful new kitchen, totally remodeled full bath with an awesome tiled bath surround. New luxury vinyl plank in the living room and kitchen. New
Charming quad-level home on private court in Bettendorf! Welcome to this lovingly maintained home by the same owner since 1987. It is now ready for its next chapter. Step inside to the main level featuring a sun filled living room dining area and kitchen. Upstairs you'll find 3 bedrooms on the upper level including the primary with its own attached full bathroom, there is also a flex room in the
Bettendorf Iowa Real Estate For Sale! Location, Location, Location! This Quad Level Split Home is Located Across the Street from Bettendorf High School & Just a Few Blocks from Bettendorf Middle School & Elementary School! It Also Has Great Features Like: 3 Good Sized Bedrooms, Large Office (Could be used as 4th Bedroom), Newer Electrical Panel, Newer Ceilings Fans in All Bedrooms, Newer Dryer,
**Coming Soon!** This updated and well-maintained 2-story Bettendorf home in the Paul Norton school district offers the perfect blend of comfort and functionality. Enjoy three finished living areas, including a living room and family room on the main level that open up to a dining area in between and a finished rec room in the basement with a fireplace and wet bar. The unfinished bonus space in
Offers will be reviewed at 8 pm on Tuesday June 24th. This beautifully updated ranch is packed with upgrades — too many to list! Featuring 3 bedrooms, 2 full bathrooms, and a non-conforming suite in the finished basement, this home has been completely transformed inside and out. Enjoy peace of mind with a brand-new exterior, featuring new vinyl siding, and step inside to discover a fully
Welcome home to this beautifully maintained 3 bedroom, 1 1/2 bath split foyer residence, perfectly blending comfort and style. Step inside to discover an open-concept living room and kitchen area filled with natural light, ideal for both everyday living and entertaining. The spacious kitchen features modern appliances, ample counter space, and flows seamlessly into the cozy living area.
Location, Location, Location!!! Charming 3-Bedroom Home in the Heart of Bettendorf! Welcome to this beautiful 3-bedroom, 2-bath home nestled in a quiet cul-de-sac in one of Bettendorf’s desirable neighborhoods. Recent updates include a new roof, siding, A/C, and furnace, giving you peace of mind and added value. Enjoy the heated bathroom floors in the primary bathroom. Step outside and enjoy
You will never find a cleaner, more immaculate home than this one. Same owner for 32 years and pride of ownership both inside and outside. Terrific location abutting St. John Vianney Church and on a quiet cul-de-sac. Oversized kitchen with solid surface countertops, maple cabinets, pantry, and planning desk. All appliances including washer/dryer to remain. Family room features woodburning
Bettendorf Ranch! 4-bedroom 3-bath. 1,892 sq ft of living space! Remodeled Kitchen features stainless steel appliances (French door fridge & double ovens!) soft close drawers, heated tile floor. Washer & dryer are included. Updated bathrooms have comfort height vanities and stools. Main bath features a jetted tub. New roof 2020, furnace & AC 2023. Large rec room with cozy gas fireplace, wet bar
This home is located at 3651 Tam-O-shanter Dr N, Bettendorf, IA 52722 and is currently priced at $270,000, approximately $177 per square foot. This property was built in 1978. 3651 Tam-O-shanter Dr N is a home located in Scott County with nearby schools including Herbert Hoover Elementary School, Bettendorf Middle School, and Bettendorf High School.
Disclaimer: Certain information contained herein is derived from information provided by parties other than Homes.com. All information provided is deemed reliable, but is not guaranteed to be accurate and should be independently verified.
IDX information is provided exclusively for personal, non-commercial use, and may not be used for any purpose other than to identify prospective properties consumers may be interested in purchasing. Information is deemed reliable but not guaranteed.