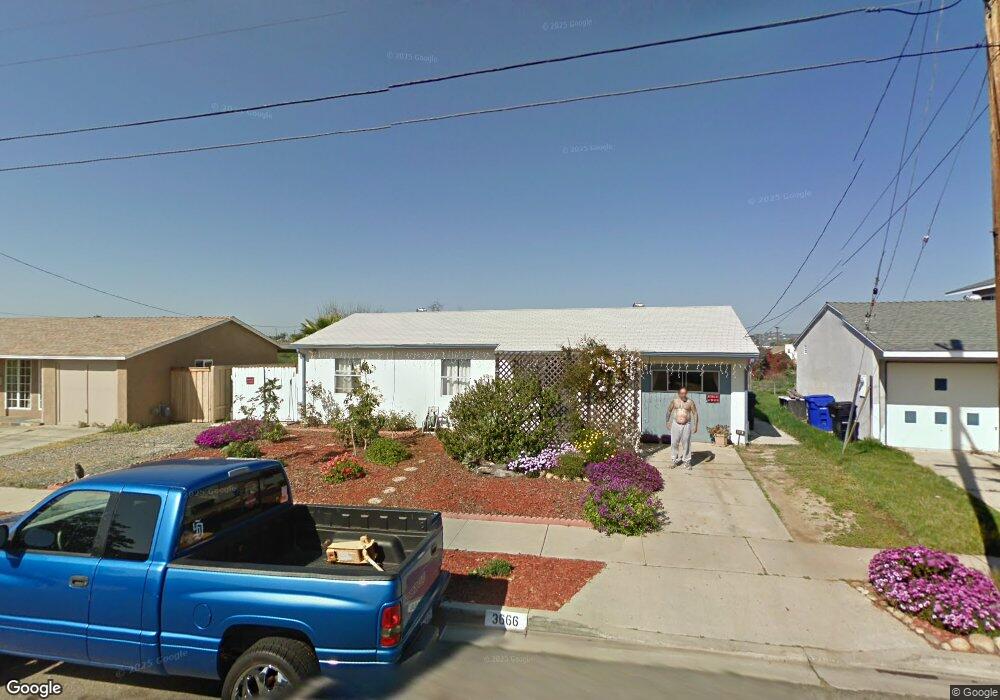
3666 Indian Way San Diego, CA 92117
Bay Ho NeighborhoodEstimated Value: $1,081,000 - $1,433,000
3
Beds
2
Baths
1,480
Sq Ft
$832/Sq Ft
Est. Value
About This Home
This home is located at 3666 Indian Way, San Diego, CA 92117 and is currently estimated at $1,231,472, approximately $832 per square foot. 3666 Indian Way is a home located in San Diego County with nearby schools including Cadman Elementary School, Marston Middle School, and Clairemont High School.
Ownership History
Date
Name
Owned For
Owner Type
Purchase Details
Closed on
Sep 18, 2025
Sold by
Swersky Mitchell P and Swersky Sharon D
Bought by
Swersky Family Trust and Swersky
Current Estimated Value
Purchase Details
Closed on
Jan 14, 2022
Sold by
Swersky Mitchell P
Bought by
Swersky Mitchell P and Swersky Sharon D
Home Financials for this Owner
Home Financials are based on the most recent Mortgage that was taken out on this home.
Original Mortgage
$750,000
Interest Rate
3.45%
Mortgage Type
New Conventional
Purchase Details
Closed on
Mar 2, 2016
Sold by
Pgi Investments Llc
Bought by
Swersky Mitchell P
Home Financials for this Owner
Home Financials are based on the most recent Mortgage that was taken out on this home.
Original Mortgage
$553,439
Interest Rate
3.72%
Mortgage Type
New Conventional
Purchase Details
Closed on
Dec 8, 2015
Sold by
Forschner Martin and Forscher Martin Thomas
Bought by
Pgi Investments Llc
Create a Home Valuation Report for This Property
The Home Valuation Report is an in-depth analysis detailing your home's value as well as a comparison with similar homes in the area
Home Values in the Area
Average Home Value in this Area
Purchase History
| Date | Buyer | Sale Price | Title Company |
|---|---|---|---|
| Swersky Family Trust | -- | None Listed On Document | |
| Swersky Mitchell P | -- | New Title Company Name | |
| Swersky Mitchell P | $615,000 | Stewart Title | |
| Pgi Investments Llc | $455,000 | Stewart Title Of Ca Inc |
Source: Public Records
Mortgage History
| Date | Status | Borrower | Loan Amount |
|---|---|---|---|
| Previous Owner | Swersky Mitchell P | $750,000 | |
| Previous Owner | Swersky Mitchell P | $553,439 |
Source: Public Records
Tax History Compared to Growth
Tax History
| Year | Tax Paid | Tax Assessment Tax Assessment Total Assessment is a certain percentage of the fair market value that is determined by local assessors to be the total taxable value of land and additions on the property. | Land | Improvement |
|---|---|---|---|---|
| 2025 | $8,800 | $728,028 | $550,462 | $177,566 |
| 2024 | $8,800 | $713,754 | $539,669 | $174,085 |
| 2023 | $8,606 | $699,760 | $529,088 | $170,672 |
| 2022 | $8,292 | $686,040 | $518,714 | $167,326 |
| 2021 | $8,234 | $672,590 | $508,544 | $164,046 |
| 2020 | $8,134 | $665,694 | $503,330 | $162,364 |
| 2019 | $7,987 | $652,642 | $493,461 | $159,181 |
| 2018 | $7,466 | $639,846 | $483,786 | $156,060 |
| 2017 | $7,287 | $627,300 | $474,300 | $153,000 |
| 2016 | $5,373 | $455,000 | $173,170 | $281,830 |
| 2015 | $521 | $41,861 | $15,932 | $25,929 |
| 2014 | $432 | $41,042 | $15,620 | $25,422 |
Source: Public Records
Map
Nearby Homes
- 4410 Gila Ave
- 3701 Tavara Cir
- 4150 Taos Dr
- 3582 Hatteras Ave
- 4182 Seri St
- 3571 Idlewild Way
- 4203 Tolowa St
- 4527 Kickapoo Ct
- 4576 Onondaga Ave
- 4380 Rolfe Rd
- 3294 Atari Ct
- 3129 Driscoll Dr
- 4543 Moraga Ave
- 4135 Huerfano Ave
- 4587 Rolfe Rd
- 4048 Raffee Dr
- 4226 Mount Voss Dr
- 4425 Caminito Pedernal
- 3212 Cadden Ct
- 4060 Huerfano Ave Unit 143
- 3660 Indian Way
- 3672 Indian Way
- 3678 Indian Way
- 3667 Indian Way
- 3675 Indian Way
- 3659 Indian Way
- 3684 Indian Way
- 3631 Mabon Place
- 3611 Mabon Place
- 3689 Indian Way
- 3621 Mabon Place
- 3690 Indian Way
- 4384 Pocahontas Ave
- 4410 Pocahontas Ave
- 3603 Mabon Place
- 4372 Pocahontas Ave
- 3641 Mabon Place
- 4416 Pocahontas Ave
- 3651 Mabon Place
- 3661 Mabon Place