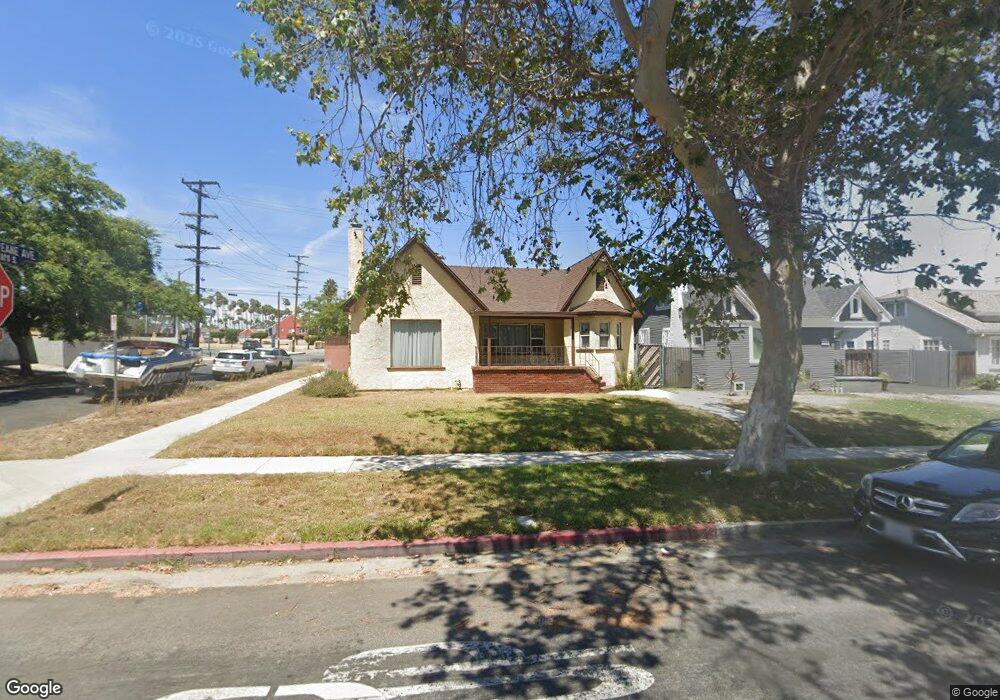
3669 W 58th Place Los Angeles, CA 90043
Hyde Park NeighborhoodEstimated Value: $888,000 - $1,107,000
2
Beds
2
Baths
1,760
Sq Ft
$557/Sq Ft
Est. Value
About This Home
This home is located at 3669 W 58th Place, Los Angeles, CA 90043 and is currently estimated at $979,646, approximately $556 per square foot. 3669 W 58th Place is a home located in Los Angeles County with nearby schools including Fifty-Fourth Street Elementary School, Horace Mann Ucla Community, and Crenshaw Science, Technology, Engineering, Math And Medicine Magnet.
Ownership History
Date
Name
Owned For
Owner Type
Purchase Details
Closed on
Apr 4, 2018
Sold by
Boston Birles Samuel
Bought by
Handcox Kenneth Lamonte
Current Estimated Value
Home Financials for this Owner
Home Financials are based on the most recent Mortgage that was taken out on this home.
Original Mortgage
$300,000
Outstanding Balance
$257,440
Interest Rate
4.44%
Mortgage Type
New Conventional
Estimated Equity
$722,206
Purchase Details
Closed on
Aug 17, 2001
Sold by
Hong Fred D
Bought by
Boston Birles Samuel and Boston Donna Cheryl
Home Financials for this Owner
Home Financials are based on the most recent Mortgage that was taken out on this home.
Original Mortgage
$146,400
Interest Rate
6.91%
Purchase Details
Closed on
Dec 30, 1999
Sold by
Hong Fred
Bought by
Hong Fred D and Fred D Hong Separate Property Trust
Create a Home Valuation Report for This Property
The Home Valuation Report is an in-depth analysis detailing your home's value as well as a comparison with similar homes in the area
Home Values in the Area
Average Home Value in this Area
Purchase History
| Date | Buyer | Sale Price | Title Company |
|---|---|---|---|
| Handcox Kenneth Lamonte | $375,000 | Priority Title | |
| Boston Birles Samuel | $183,000 | Fidelity National Title Co | |
| Hong Fred D | -- | -- |
Source: Public Records
Mortgage History
| Date | Status | Borrower | Loan Amount |
|---|---|---|---|
| Open | Handcox Kenneth Lamonte | $300,000 | |
| Previous Owner | Boston Birles Samuel | $146,400 |
Source: Public Records
Tax History Compared to Growth
Tax History
| Year | Tax Paid | Tax Assessment Tax Assessment Total Assessment is a certain percentage of the fair market value that is determined by local assessors to be the total taxable value of land and additions on the property. | Land | Improvement |
|---|---|---|---|---|
| 2025 | $8,412 | $689,064 | $603,047 | $86,017 |
| 2024 | $8,412 | $675,554 | $591,223 | $84,331 |
| 2023 | $8,255 | $662,309 | $579,631 | $82,678 |
| 2022 | $7,879 | $649,323 | $568,266 | $81,057 |
| 2021 | $7,781 | $636,592 | $557,124 | $79,468 |
| 2020 | $7,859 | $630,066 | $551,412 | $78,654 |
| 2019 | $7,551 | $617,712 | $540,600 | $77,112 |
| 2018 | $3,062 | $245,376 | $190,071 | $55,305 |
| 2016 | $2,922 | $235,850 | $182,692 | $53,158 |
| 2015 | $2,880 | $232,308 | $179,948 | $52,360 |
| 2014 | $2,898 | $227,759 | $176,424 | $51,335 |
Source: Public Records
Map
Nearby Homes
- 5868 Deane Ave
- 3749 W 59th St
- 3632 W 59th St
- 5732 Hillcrest Dr
- 3663 W 60th St
- 5612 S Rimpau Blvd
- 3815 W 60th St
- 5742 Chesley Ave
- 3521 W 58th Place
- 5738 Chesley Ave
- 3854 W 59th St
- 3831 W 60th St
- 6018 S Harcourt Ave
- 5414 S Mullen Ave
- 5429 Chesley Ave
- 6021 Brynhurst Ave
- 5419 S Harcourt Ave
- 6125 West Blvd
- 3626 W 62nd St
- 5465 S Victoria Ave
- 3665 W 58th Place
- 3661 W 58th Place
- 3703 W 58th Place
- 3662 W Slauson Ave
- 3655 W 58th Place
- 3707 W 58th Place
- 3668 W Slauson Ave
- 3668 W 58th Place
- 3664 W 58th Place
- 3649 W 58th Place
- 3713 W 58th Place
- 3660 W 58th Place
- 3702 W 58th Place
- 3654 W 58th Place
- 3652 W 58th Place
- 3643 W 58th Place
- 3708 W 58th Place
- 3717 W 58th Place
- 3648 W 58th Place
- 3712 W 58th Place