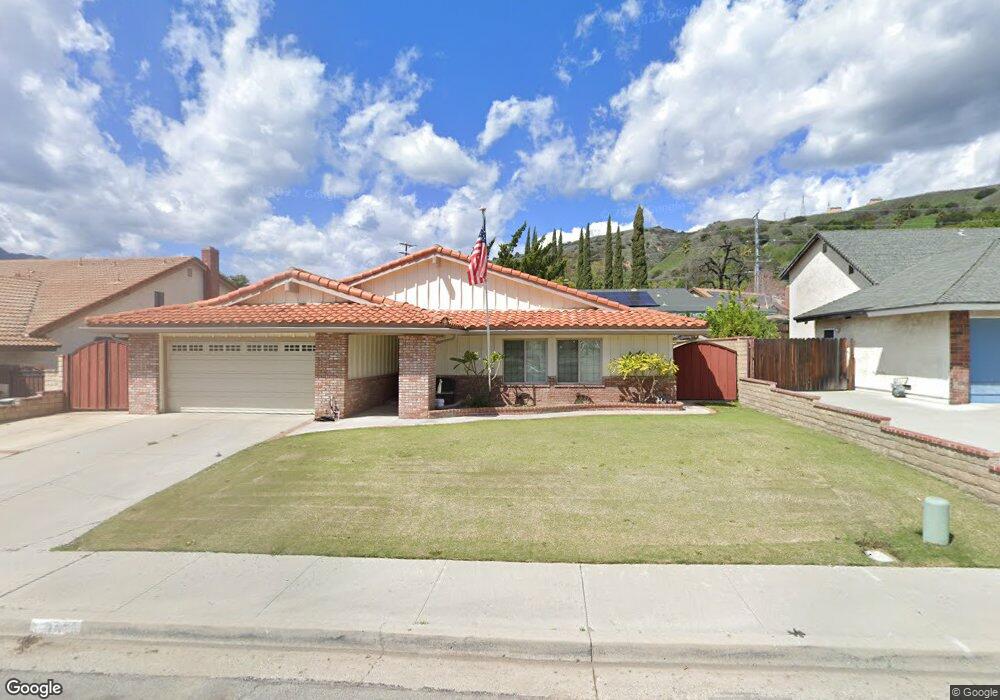
367 4th St Fillmore, CA 93015
Estimated Value: $715,000 - $776,000
3
Beds
2
Baths
1,753
Sq Ft
$421/Sq Ft
Est. Value
About This Home
This home is located at 367 4th St, Fillmore, CA 93015 and is currently estimated at $737,283, approximately $420 per square foot. 367 4th St is a home located in Ventura County with nearby schools including San Cayetano Elementary School and Fillmore Senior High.
Ownership History
Date
Name
Owned For
Owner Type
Purchase Details
Closed on
Jun 21, 2023
Sold by
Largen Mike W and Largen Julie A
Bought by
Largen Family Trust and Largen
Current Estimated Value
Purchase Details
Closed on
May 23, 2002
Sold by
Craig Jarrad P and Craig Tina M
Bought by
Largen Mike W and Largen Julie A
Home Financials for this Owner
Home Financials are based on the most recent Mortgage that was taken out on this home.
Original Mortgage
$284,050
Interest Rate
6.74%
Purchase Details
Closed on
Jul 6, 1998
Sold by
Bittl Ann H
Bought by
Craig Jarrad P and Craig Tina M
Home Financials for this Owner
Home Financials are based on the most recent Mortgage that was taken out on this home.
Original Mortgage
$162,000
Interest Rate
6.95%
Mortgage Type
Assumption
Create a Home Valuation Report for This Property
The Home Valuation Report is an in-depth analysis detailing your home's value as well as a comparison with similar homes in the area
Home Values in the Area
Average Home Value in this Area
Purchase History
| Date | Buyer | Sale Price | Title Company |
|---|---|---|---|
| Largen Family Trust | -- | None Listed On Document | |
| Largen Mike W | $299,000 | Old Republic Title Ins Compa | |
| Craig Jarrad P | $175,000 | Old Republic Title Company |
Source: Public Records
Mortgage History
| Date | Status | Borrower | Loan Amount |
|---|---|---|---|
| Previous Owner | Largen Mike W | $284,050 | |
| Previous Owner | Craig Jarrad P | $162,000 |
Source: Public Records
Tax History
| Year | Tax Paid | Tax Assessment Tax Assessment Total Assessment is a certain percentage of the fair market value that is determined by local assessors to be the total taxable value of land and additions on the property. | Land | Improvement |
|---|---|---|---|---|
| 2025 | $4,820 | $441,689 | $176,673 | $265,016 |
| 2024 | $4,820 | $433,029 | $173,209 | $259,820 |
| 2023 | $4,753 | $424,539 | $169,813 | $254,726 |
| 2022 | $4,392 | $416,215 | $166,483 | $249,732 |
| 2021 | $4,995 | $408,054 | $163,218 | $244,836 |
| 2020 | $4,632 | $403,873 | $161,546 | $242,327 |
| 2019 | $4,644 | $395,955 | $158,379 | $237,576 |
| 2018 | $4,550 | $388,192 | $155,274 | $232,918 |
| 2017 | $4,575 | $380,581 | $152,230 | $228,351 |
| 2016 | $4,233 | $373,120 | $149,246 | $223,874 |
| 2015 | $4,114 | $367,517 | $147,005 | $220,512 |
| 2014 | $3,797 | $333,000 | $133,000 | $200,000 |
Source: Public Records
Map
Nearby Homes
- 345 Blaine Ave
- 639 Mountain View St
- 1000 Foothill Dr
- 809 Woodgrove Rd
- 815 Woodgrove Rd
- 616 Island View St
- 318 Bard St
- 300 Fillmore St
- 444 Mountain View St
- 404 Central Ave
- 340 Central Ave
- 831 Blaine Ave
- 947 Meadowlark Dr
- 158 Arborwood St
- 252 Driftwood St
- 199 Rosewood St
- 1560 Goodenough Rd
- 534 Mulberry Ln
- 458 Edgewood Dr
- 513 Heritage Valley Pkwy
Your Personal Tour Guide
Ask me questions while you tour the home.