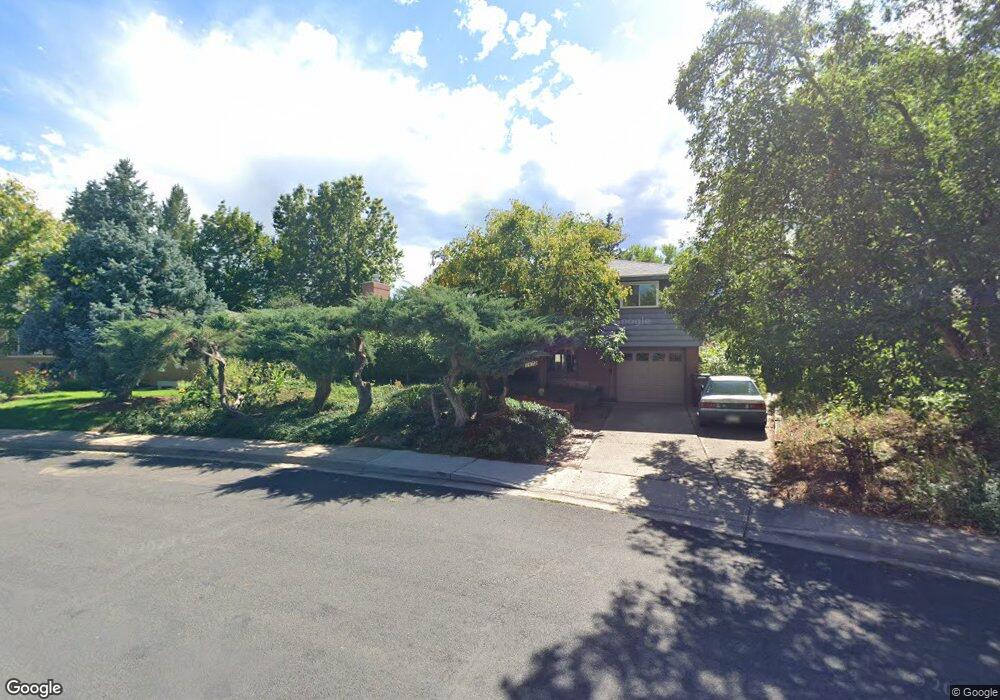
3672 Chase Ct Boulder, CO 80305
South Boulder NeighborhoodEstimated Value: $864,000 - $893,000
3
Beds
2
Baths
1,150
Sq Ft
$762/Sq Ft
Est. Value
About This Home
This home is located at 3672 Chase Ct, Boulder, CO 80305 and is currently estimated at $876,138, approximately $761 per square foot. 3672 Chase Ct is a home located in Boulder County with nearby schools including Creekside Elementary School, Manhattan Middle School of the Arts & Academics, and Fairview High School.
Ownership History
Date
Name
Owned For
Owner Type
Purchase Details
Closed on
Mar 25, 2016
Sold by
Mcbride Valery S and Mcbride Richard C
Bought by
Mcbride Valerie S
Current Estimated Value
Purchase Details
Closed on
Sep 25, 2015
Sold by
Mcbride Richard C and Conrad Rosemary Mcbride Living
Bought by
Mcbride Richard C
Purchase Details
Closed on
Dec 20, 2007
Sold by
Mcbride Conrad L
Bought by
Conrad & Rosemary Mcbride Living Trust
Create a Home Valuation Report for This Property
The Home Valuation Report is an in-depth analysis detailing your home's value as well as a comparison with similar homes in the area
Home Values in the Area
Average Home Value in this Area
Purchase History
| Date | Buyer | Sale Price | Title Company |
|---|---|---|---|
| Mcbride Valerie S | -- | None Available | |
| Mcbride Richard C | -- | None Available | |
| Conrad & Rosemary Mcbride Living Trust | -- | None Available |
Source: Public Records
Tax History
| Year | Tax Paid | Tax Assessment Tax Assessment Total Assessment is a certain percentage of the fair market value that is determined by local assessors to be the total taxable value of land and additions on the property. | Land | Improvement |
|---|---|---|---|---|
| 2025 | $5,094 | $53,381 | $48,043 | $5,338 |
| 2024 | $5,094 | $53,381 | $48,043 | $5,338 |
| 2023 | $5,006 | $57,968 | $55,488 | $6,165 |
| 2022 | $4,564 | $49,143 | $44,229 | $4,914 |
| 2021 | $4,352 | $50,558 | $45,502 | $5,056 |
| 2020 | $4,271 | $49,064 | $39,254 | $9,810 |
| 2019 | $4,205 | $49,064 | $39,254 | $9,810 |
| 2018 | $3,986 | $45,979 | $36,432 | $9,547 |
| 2017 | $3,862 | $50,833 | $40,278 | $10,555 |
| 2016 | $3,505 | $40,493 | $25,313 | $15,180 |
| 2015 | $3,319 | $32,366 | $16,557 | $15,809 |
| 2014 | $2,098 | $32,366 | $16,557 | $15,809 |
Source: Public Records
Map
Nearby Homes
- 3805 Martin Dr
- 210 S 39th St
- 345 S 38th St
- 3000 Dartmouth Ave
- 450 S 41st St
- 4453 Hamilton Ct
- 2955 Stanford Ave
- 4595 Moorhead Ave
- 780 33rd St
- 2585 Kohler Dr
- 4835 Moorhead Ave
- 810 37th St
- 725 S 45th St
- 4475 Laguna Place Unit 206
- 4415 Laguna Place Unit 201
- 805 29th St Unit 253
- 805 29th St Unit 157
- 805 29th St Unit 402
- 805 29th St Unit 404
- 905 36th St
Your Personal Tour Guide
Ask me questions while you tour the home.